. 2008 Jun 19;453(7198):1112-6.
doi: 10.1038/nature06973. Epub 2008 May 25.

Synergistic response to oncogenic mutations defines gene class critical to cancer phenotype

Affiliations

Synergistic response to oncogenic mutations defines gene class critical to cancer phenotype

Helene R McMurray et al. Nature. .

Abstract

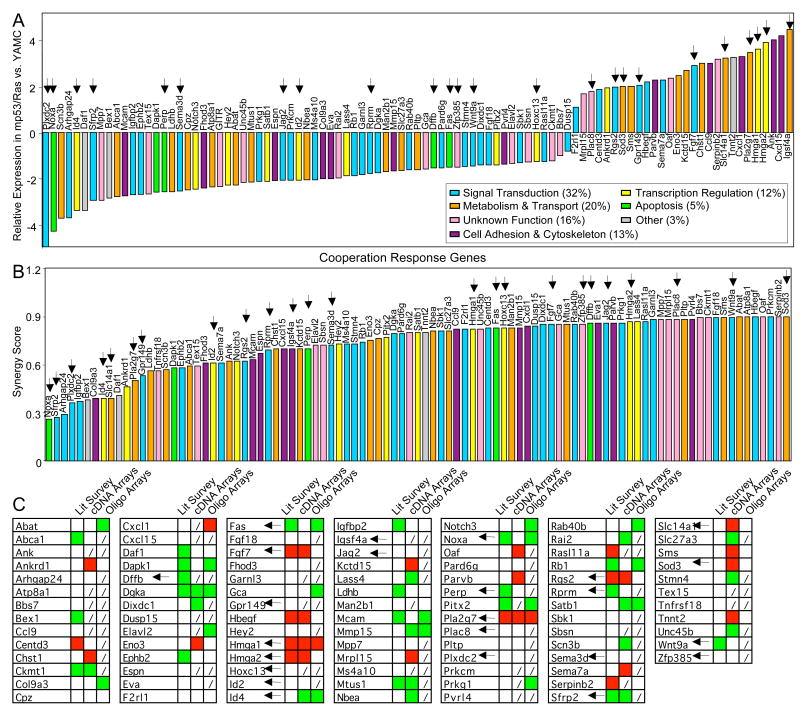
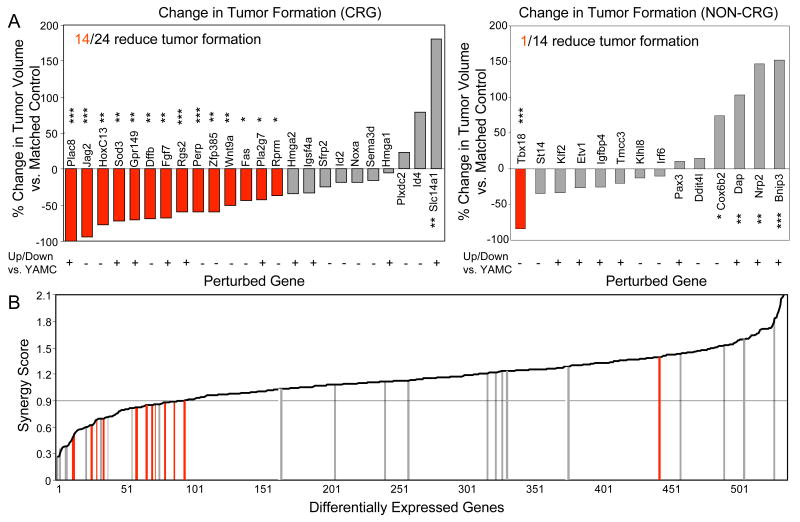
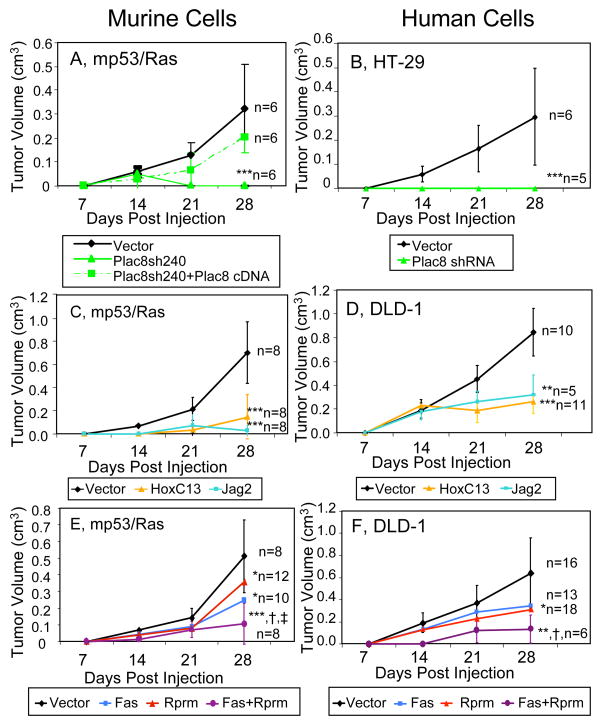
Understanding the molecular underpinnings of cancer is of critical importance to the development of targeted intervention strategies. Identification of such targets, however, is notoriously difficult and unpredictable. Malignant cell transformation requires the cooperation of a few oncogenic mutations that cause substantial reorganization of many cell features and induce complex changes in gene expression patterns. Genes critical to this multifaceted cellular phenotype have therefore only been identified after signalling pathway analysis or on an ad hoc basis. Our observations that cell transformation by cooperating oncogenic lesions depends on synergistic modulation of downstream signalling circuitry suggest that malignant transformation is a highly cooperative process, involving synergy at multiple levels of regulation, including gene expression. Here we show that a large proportion of genes controlled synergistically by loss-of-function p53 and Ras activation are critical to the malignant state of murine and human colon cells. Notably, 14 out of 24 'cooperation response genes' were found to contribute to tumour formation in gene perturbation experiments. In contrast, only 1 in 14 perturbations of the genes responding in a non-synergistic manner had a similar effect. Synergistic control of gene expression by oncogenic mutations thus emerges as an underlying key to malignancy, and provides an attractive rationale for identifying intervention targets in gene networks downstream of oncogenic gain- and loss-of-function mutations.


Figures

Figure 1
Figure 1. Identification and characterization of cooperation response genes (CRGs)
Raw expression values (log2) of 538 differentially expressed genes (represented by 657 probe sets) for mp53, Ras and mp53/Ras cells, as compared to YAMC controls, are shown rank ordered according to synergy score. Red and green indicate relative gene expression in the cells indicated versus YAMC cells. Purple or blue indicate the synergy score for each gene plotted. A synergy score of 0.9 or less defines CRGs. The cut off is indicated by arrowheads or the threshold line (stippled).
Figure 2
Figure 2. Differential expression and synergy scores of CRGs in mp53/Ras cells and CRG co-regulation in human colon cancer
Bar graphs ranking CRG expression measured by microarray in mp53/Ras vs. YAMC cells (A) and CRG synergy scores (B). Bars are color-coded for gene-associated biological processes according to Gene Ontology (GO) database. C) Table summarizing co-regulation of CRGs in mp53/Ras cells and human cancer based on literature survey for a variety of human cancers and two independent expression analyses of primary human colon cancers. Up- or down-regulation of CRG expression vs. controls is indicated by red or green, lack of CRG representation on arrays by (/). Arrows indicate genes perturbed in this study.
Figure 3
Figure 3. Synergistic response of downstream genes to oncogenic mutations is a strong predictor for critical role in malignant transformation
(A) Bar graphs indicating percent change in endpoint tumor volume following CRG and non-CRG perturbations in mp53/Ras cells (left and right panel, respectively). Perturbations significantly decreasing tumor size, as compared to matched controls are shown in red (***, p<0.001; **, p<0.01; *, p<0.05; Wilcoxn signed-rank and t-test). (B) Distribution of gene perturbations over the set of genes differentially expressed in mp53/Ras cells, rank-ordered by synergy score. Bars, color-coded as above, indicate perturbed genes. CRG cut-off synergy score (0.9) is indicated by horizontal line.
Figure 4
Figure 4. CRG perturbations reduce tumor formation of both mp53/Ras and human cancer cells
Tumor volume was measured weekly for 4 weeks following injection into nude mice of murine (A, C, E) and human cancer cells (B, D, F) with indicated perturbations. Error bars indicate standard deviation at each time point. Number of injections (n) and significance levels as compared to matched controls are indicated (***, p<0.001; **, p<0.01; *, p<0.05). Significance of tumor reduction upon combined perturbation Fas + Rprm as compared to individual perturbations is indicated as follows: vs. Fas (†, p<0.05), vs. Rprm (‡, p<0.05).

Comment in

References

    1. Hanahan D, Weinberg RA. The hallmarks of cancer. Cell. 2000;100:57–70. - PubMed
    1. Yu J, et al. Identification and classification of p53-regulated genes. Proc Natl Acad Sci U S A. 1999;96:14517–22. - PMC - PubMed
    1. Zhao R, et al. Analysis of p53-regulated gene expression patterns using oligonucleotide arrays. Genes Dev. 2000;14:981–93. - PMC - PubMed
    1. Schulze A, Lehmann K, Jefferies HB, McMahon M, Downward J. Analysis of the transcriptional program induced by Raf in epithelial cells. Genes Dev. 2001;15:981–94. - PMC - PubMed
    1. Huang E, et al. Gene expression phenotypic models that predict the activity of oncogenic pathways. Nat Genet. 2003;34:226–30. - PubMed

Publication types

Associated data