. 2008 May 23:9:246.
doi: 10.1186/1471-2164-9-246.

Correlation of mRNA and protein levels: cell type-specific gene expression of cluster designation antigens in the prostate

Affiliations

Correlation of mRNA and protein levels: cell type-specific gene expression of cluster designation antigens in the prostate

Laura E Pascal et al. BMC Genomics. .

Abstract

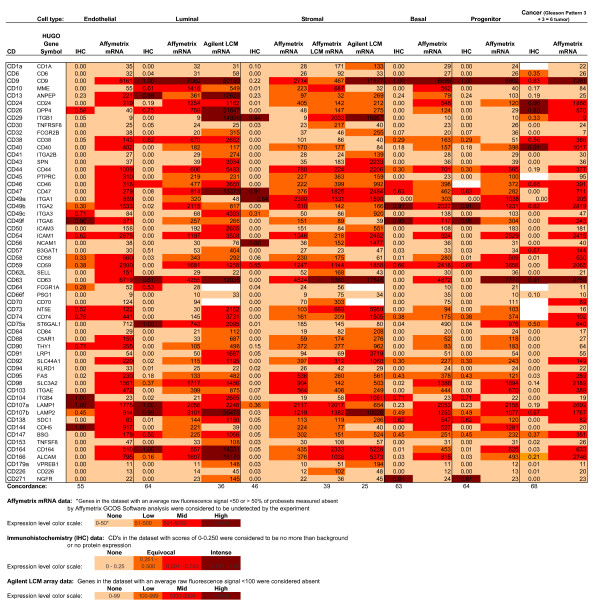
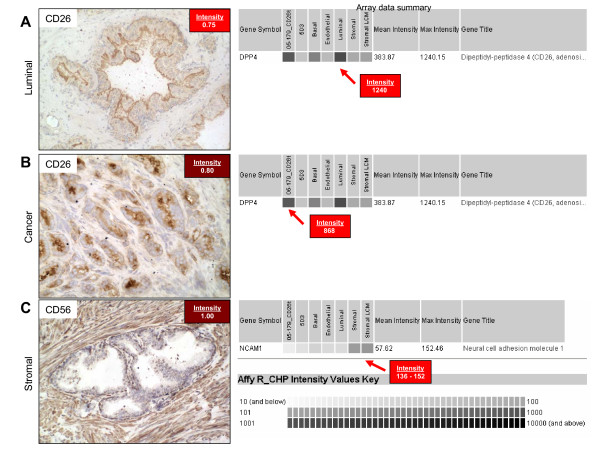
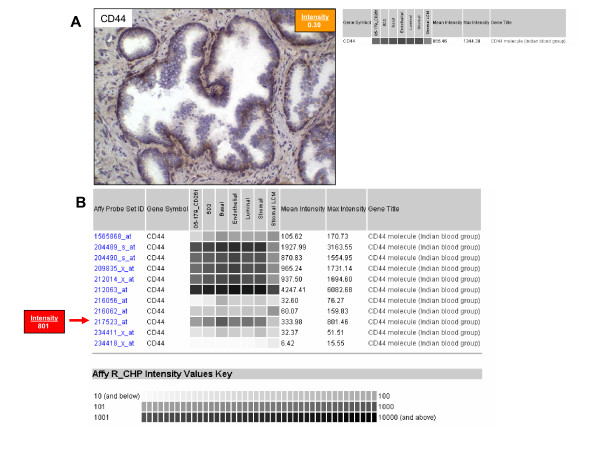
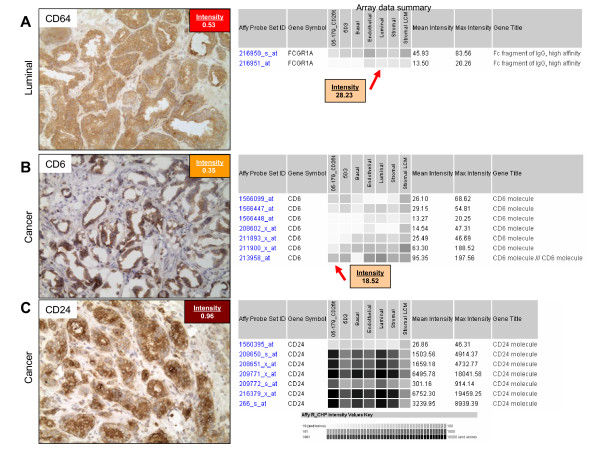
Background: : Expression levels of mRNA and protein by cell types exhibit a range of correlations for different genes. In this study, we compared levels of mRNA abundance for several cluster designation (CD) genes determined by gene arrays using magnetic sorted and laser-capture microdissected human prostate cells with levels of expression of the respective CD proteins determined by immunohistochemical staining in the major cell types of the prostate - basal epithelial, luminal epithelial, stromal fibromuscular, and endothelial - and for prostate precursor/stem cells and prostate carcinoma cells. Immunohistochemical stains of prostate tissues from more than 50 patients were scored for informative CD antigen expression and compared with cell-type specific transcriptomes.

Results: : Concordance between gene and protein expression findings based on 'present' vs. 'absent' calls ranged from 46 to 68%. Correlation of expression levels was poor to moderate (Pearson correlations ranged from 0 to 0.63). Divergence between the two data types was most frequently seen for genes whose array signals exceeded background (> 50) but lacked immunoreactivity by immunostaining. This could be due to multiple factors, e.g. low levels of protein expression, technological sensitivities, sample processing, probe set definition or anatomical origin of tissue and actual biological differences between transcript and protein abundance.

Conclusion: : Agreement between these two very different methodologies has great implications for their respective use in both molecular studies and clinical trials employing molecular biomarkers.


Figures

Figure 1
Figure 1
CD expression summary. CD expression levels of prostate tissue as scored by immunostaining (IHC) and gene array (mRNA) for each constituent cell type. Overall concordance between IHC and MACS-sorted cell gene array ranged from 46 to 67% and was determined as the percentage of agreement for each cell type based on 'present' or 'absent' call for the total number of IHC and mRNA determinations. Concordance between IHC and LCM Affymetrix gene array for stromal cells was 39%. Concordance between IHC and LCM Agilent gene array was 25% for stromal cells and 36% for luminal cells.
Figure 2
Figure 2
Data-type concordance for CD26 and CD56. CD immunoreactivity of prostate cells (immunoreaction product red-brown; pale blue hematoxylin nuclear counterstain) and corresponding gene expression data (darker shading of the boxes indicates higher mRNA levels). A. CD26 staining in normal prostate tissue was confined to luminal cells with a staining intensity of 0.75, this correlated well with array data summary where a maximum gene expression level of 1240 was found for luminal cells. B. CD26 staining in prostate cancer was restricted to cancer cells with a staining intensity of 0.80, this correlates with array data where a maximum gene expression level of 868 was found for the cancer cells. C. CD56 staining in normal prostate tissue was confined to stromal cells with a staining intensity of 1.00, this agreed with array data where maximum gene expression level of 136 was found for stromal cells. Original magnification: 200×.
Figure 3
Figure 3
Data-type discordance for CD44. CD44 immunoreactivity of prostate cells and corresponding gene expression data. A. CD44 staining in normal prostate was confined to basal cells with a staining intensity of 0.30, this contrasted with array data where gene expression levels were similar across all cell types. Original magnification: 200×. B. Examination of individual probesets showed that 217523_at was most similar to immunostaining results with a maximum gene expression level of 683 for basal cells.
Figure 4
Figure 4
Data-type discordance for CD64, CD6 and CD24. CD immunoreactivity of prostate cells and corresponding gene expression data. A. CD64 staining of normal prostate was confined to luminal cells with a staining intensity of 0.53, contrasting with the array data where gene expression levels were absent across all cell types and for all probe sets. B. CD6 staining in prostate cancer was confined to cancer cells with a staining intensity of 0.35, in contrast with the array data where gene expression levels were absent across all cell types and for all probe sets with the exception of probe set 213958_at, where cancer, endothelial and luminal expression were present. C. CD24 staining in prostate cancer was confined to luminal cells with a staining intensity of 0.96, this contrasts with the array data where gene expression levels were present across all cell types and for all probesets with the exception of probeset 1560395_at, where expression levels were absent for all cell types. Original magnification: 200×.

References

    1. Gygi SP, Rochon Y, Franza BR, Aebersold R. Correlation between protein and mRNA abundance in yeast. Mol Cell Biol. 1999;19:1720–1730. - PMC - PubMed
    1. Chen G, Gharib TG, Huang CC, Taylor JM, Misek DE, Kardia SL, Giordano TJ, Iannettoni MD, Orringer MB, Hanash SM, Beer DG. Discordant protein and mRNA expression in lung adenocarcinomas. Mol Cell Proteomics. 2002;1:304–313. doi: 10.1074/mcp.M200008-MCP200. - DOI - PubMed
    1. Lichtinghagen R, Musholt PB, Lein M, Romer A, Rudolph B, Kristiansen G, Hauptmann S, Schnorr D, Loening SA, Jung K. Different mRNA and protein expression of matrix metalloproteinases 2 and 9 and tissue inhibitor of metalloproteinases 1 in benign and malignant prostate tissue. Eur Urol. 2002;42:398–406. doi: 10.1016/S0302-2838(02)00324-X. - DOI - PubMed
    1. Schlemmer BO, Sorensen BS, Overgaard J, Olsen KE, Gjerdrum LM, Nexo E. Quantitative PCR--new diagnostic tool for quantifying specific mRNA and DNA molecules: HER2/neu DNA quantification with LightCycler real-time PCR in comparison with immunohistochemistry and fluorescence in situ hybridization. Scand J Clin Lab Invest. 2004;64:511–522. doi: 10.1080/00365510410002922. - DOI - PubMed
    1. Waghray A, Feroze F, Schober MS, Yao F, Wood C, Puravs E, Krause M, Hanash S, Chen YQ. Identification of androgen-regulated genes in the prostate cancer cell line LNCaP by serial analysis of gene expression and proteomic analysis. Proteomics. 2001;1:1327–1338. doi: 10.1002/1615-9861(200110)1:10<1327::AID-PROT1327>3.0.CO;2-B. - DOI - PubMed

Publication types

MeSH terms

LinkOut - more resources