. 2008 May 26:5:20.
doi: 10.1186/1742-2094-5-20.

Novel role for SLPI in MOG-induced EAE revealed by spinal cord expression analysis

Affiliations

Novel role for SLPI in MOG-induced EAE revealed by spinal cord expression analysis

Andre M Mueller et al. J Neuroinflammation. .

Abstract

Background: Experimental autoimmune encephalomyelitis (EAE) induced by myelin oligodendrocyte protein (MOG) in female Dark Agouti (DA) rats is a chronic demyelinating animal model of multiple sclerosis (MS). To identify new candidate molecules involved in the evolution or repair of EAE-lesions we used Affymetrix oligonucleotide microarrays to compare the spinal cord transcriptome at the peak of EAE, during remission and at the first relapse with healthy DA rats.

Methods: Untreated DA rats and DA rats immunised with MOG protein were sacrificed at defined time points. Total RNA was isolated from spinal cord tissue and used for hybridization of Affymetrix rat genome arrays RG U34 A-C. Selected expression values were confirmed by RealTime PCR. Adult neural stem cells were incubated with recombinant secretory leukocyte protease inhibitor (SLPI). Proliferation was assessed by BrdU incorporation, cyclin D1 and HES1 expression by RealTime PCR, cell differentiation by immunofluorescence analysis and I kappa B alpha degradation by Western blot.

Results: Among approximately 26,000 transcripts studied more than 1,100 were differentially regulated. Focussing on functional themes, we noticed a sustained downregulation of most of the transcripts of the cholesterol biosynthesis pathway. Furthermore, we found new candidate genes possibly contributing to regenerative processes in the spinal cord. Twelve transcripts were solely upregulated in the recovery phase, including genes not previously associated with repair processes. Expression of SLPI was upregulated more than hundredfold during EAE attack. Using immunohistochemistry, SLPI was identified in macrophages, activated microglia, neuronal cells and astrocytes. Incubation of adult neural stem cells (NSC) with recombinant SLPI resulted in an increase of cell proliferation and of differentiation towards oligodendrocytes. These processes were paralleled by an upregulation of the cell-cycle promotor cyclin D1 and a suppression of the cell differentiation regulator HES1. Finally, SLPI prevented the degradation of I kappa B alpha, which may explain the suppression of the cell differentiation inhibitor HES1 suggesting a possible mechanism of oligodendroglial differentiation.

Conclusion: We identified novel features of gene expression in the CNS during EAE, in particular the suppression of genes of cholesterol biosynthesis and a strong upregulation of SLPI, a gene which is for the first time associated with autoimmune inflammation. The capacity of SLPI to increase proliferation of adult NSC and of oligodendroglial differentiation suggests a novel role for SLPI in the promotion of tissue repair, beyond its known functions in the prevention of tissue damages by protease inhibition damage and modulation of inflammatory reactions.


Figures

Figure 1
Figure 1
Summary of the clinical courses and cumulative scores of the DA rats chosen for the microarray expression study. A) acute phase, B) recovery phase, C) relapsing phase, D) cumulative disease scores (area under the curve) of the examined animals.
Figure 2
Figure 2
Principal component analysis of the RG U34A hybridizations performed with BRB Array Tools. Hybridization patterns from healthy rats and from rats in the acute and the recovery phase form clusters. This is not the case for hybridization patterns from rats in the relapsing phase.
Figure 3
Figure 3
Summary of the clinical courses and cumulative scores of the DA rats chosen for the RealTime-PCR experiments. A) acute phase, B) recovery phase, C) relapsing phase, D) cumulative disease scores (area under the curve) of the examined animals.
Figure 4
Figure 4
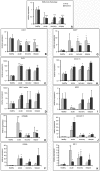
Confirmation of expression values obtained by microarray hybridization with RealTime-PCR values obtained from different samples others than those used for microarray hybridization but with comparable disease course (values are always normalised to quantity of 18S rRNA and presented + std dev, four animals per group) for following genes: A) HMG-CoA Reductase, B) Low density lipoprotein receptor (LDLR), C) Secretory leukocyte protease inhibitor (SLPI), D) MAP1alpha, E) Glycoprotein NMB (GPNMB), F) Downregulated by Activation gene (DORA), G) B cell-activating factor (BAFF), H) CXCL13, I) Myelin-oligodendrocyte-glycoprotein (MOG), J) Lipocalin 2 and K) Interferon-g regulated-factor-1 (IRF-1). The different disease phase were statistically compared using One Way ANOVA analysis of variance (Holm-Sidak method):*:p < 0.05, **: p < 0.01, ***: p < 0.001.
Figure 5
Figure 5
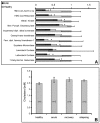
Downregulation of the cholesterol biosynthesis pathway during EAE. A: Summary of the average expression values of genes of the cholesterol biosynthesis pathway (± std dev). As we only noticed minor differences of the expression of these genes within the observed disease phases, the expression values obtained for the acute, recovery and relapsing disease phase were merged to one value representing the average expression of the particular gene during EAE. All values are correlated to the expression values of the corresponding gene in the spinal cord of healthy rats. The EAE gene expression was compared to the expression within healthy rats using a paired t test. *: p < 0.05. B: Average cholesterol concentration in spinal cord extracts. Rats from distinct disease phase were sacrificed, their spinal cord dissected and lipids and lipoproteins extracted by RIPA buffer. Cholesterol concentrations were determined as described in Material and Methods.
Figure 6
Figure 6
SLPI protein is expressed in the spinal cord during the acute and the relapsing phase. SLPI-staining of longitudinal spinal cord slices obtained from DA rats. A: healthy animal, B: acute phase (score 3.5) and C: relapsing phase (score 3.5), (Magnification 50x).
Figure 7
Figure 7
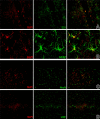
SLPI expression within the spinal cord is associated with ED1-expressing macrophages or activated microglia in the acute phase (score 3.5, A) and with GFAP-positive astrocytes (B) and NeuN expressing neuronal cells (C) especially during the relapsing phase (score 3.5); there was no association of SLPI with von-Willebrand-factor positive endothelial cells (D). Magnification: 100x.
Figure 8
Figure 8
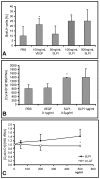
SLPI promotes proliferation of adult neural stem cells and induces cyclin D1. A: Proliferation of rat neural stem cells after treatment with SLPI or VEGF, respectively. Cells were treated with indicated amounts of SLPI or VEGF for three days. Afterwards, they were pulsed with 10 μM BrdU. Proportion of BrdU-positive cells (+ std dev) was determined with the FITC BrdU Flow Kit. Presentation of a representative result of three experiments. *:p < 0.05 (according to a One Way ANOVA analysis of variance (Holm-Sidak method). B: RealTime-PCR assessment of cyclin D1 expression (n = 3, + std dev) in rat adult stem cells after an incubation period of three days with the indicated amounts of SLPI or VEGF, respectively. C: Determination of cyclin D1 expression (n = 3, + std dev) of adult neural stem cells treated for three days with indicated amounts of SLPI or α1-AT. Presentation of a representative result of three experiments.*:p < 0.05 (according to a One Way ANOVA analysis of variance (Holm-Sidak method)).
Figure 9
Figure 9
Confirmation of specificity of SLPI's effects on NSCs. Determination of cyclin D1 expression (+ std dev) of adult neural stem cells treated for three days with indicated amounts of SLPI with or without 2 μg/ml SLPI. *: p < 0.05 referred to the difference of cyclin D1 expression of cultures incubated with or without SLPI antibodies (according to a paired t test).
Figure 10
Figure 10
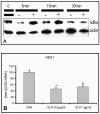
SLPI prevents TNFα-induced IκBα degradation and suppresses HES1. A: Western Blot for IκBα with protein extracts from neural stem cells stimulated for the indicated periods with 10 ng/ml TNFα with (+) or without (-) 500 ng/ml SLPI. Presentation of one of two experiments. B: RealTime-PCR assessment of HES1 expression (n = 3, + std dev) in rat adult NSC after an incubation period of three days with the indicated amounts of SLPI and consecutive four days in differentiation medium. Presentation of a representative result of three experiments. *:p < 0.05, **: p < 0.01 (according to a One Way ANOVA analysis of variance (Holm-Sidak method)).
Figure 11
Figure 11
SLPI enhances the differentiation of oligodendroglial cells. Differentiation and cell death analysis of NSC treated with indicated amounts of SLPI. NSC mounted on microscope slides were cultivated for three days with the specified amounts of SLPI in growth medium and subsequently for seven days in differentiation medium. Cells were stained for cell specific markers and counted. The shown values are representative for three independent experiments. A: proportion of GFAP positive astroglial cells (± std dev), B: proportion of βIII-tubulin positive neuronal cells (± std dev), C: proportion of GalC expressing oligodendrocytes (± std dev). *: p < 0.05 (according to a One Way ANOVA analysis of variance (Holm-Sidak method)). D: To detect dying cells, 50 μg/ml propidium iodide was added to the culture medium. After ten minutes of incubation. The fraction of PI positive cells and the total cell number was determined by counting. Presentation of the proportion of dying cells and total cell number (± std dev).

Similar articles

Cited by

References

    1. Prat A, Antel J. Pathogenesis of multiple sclerosis. Curr Opin Neurol. 2005;18:225–230. doi: 10.1097/01.wco.0000169737.99040.31. - DOI - PubMed
    1. Ibrahim SM, Gold R. Genomics, proteomics, metabolomics: what is in a word for multiple sclerosis? Curr Opin Neurol. 2005;18:231–235. doi: 10.1097/01.wco.0000169738.06664.3b. - DOI - PubMed
    1. Steinman L. Assessment of animal models for MS and demyelinating disease in the design of rational therapy. Neuron. 1999;24:511–514. doi: 10.1016/S0896-6273(00)81107-1. - DOI - PubMed
    1. Carmody RJ, Hilliard B, Maguschak K, Chodosh LA, Chen YH. Genomic scale profiling of autoimmune inflammation in the central nervous system: the nervous response to inflammation. J Neuroimmunol. 2002;133:95–107. doi: 10.1016/S0165-5728(02)00366-1. - DOI - PubMed
    1. Chabas D, Baranzini SE, Mitchell D, Bernard CC, Rittling SR, Denhardt DT, Sobel RA, Lock C, Karpuj M, Pedotti R, Heller R, Oksenberg JR, Steinman L. The influence of the proinflammatory cytokine, osteopontin, on autoimmune demyelinating disease. Science. 2001;294:1731–1735. doi: 10.1126/science.1062960. - DOI - PubMed

Publication types

MeSH terms

Substances