. 2008 Aug;242(1-2):141-53.
doi: 10.1016/j.heares.2008.03.006. Epub 2008 Apr 6.

Current focusing and steering: modeling, physiology, and psychophysics

Affiliations

Current focusing and steering: modeling, physiology, and psychophysics

Ben H Bonham et al. Hear Res. 2008 Aug.

Abstract

Current steering and current focusing are stimulation techniques designed to increase the number of distinct perceptual channels available to cochlear implant (CI) users by adjusting currents applied simultaneously to multiple CI electrodes. Previous studies exploring current steering and current focusing stimulation strategies are reviewed, including results of research using computational models, animal neurophysiology, and human psychophysics. Preliminary results of additional neurophysiological and human psychophysical studies are presented that demonstrate the success of current steering strategies in stimulating auditory nerve regions lying between physical CI electrodes, as well as current focusing strategies that excite regions narrower than those stimulated using monopolar configurations. These results are interpreted in the context of perception and speech reception by CI users. Disparities between results of physiological and psychophysical studies are discussed. The differences in stimulation used for physiological and psychophysical studies are hypothesized to contribute to these disparities. Finally, application of current steering and focusing strategies to other types of auditory prostheses is also discussed.


Figures

Fig. 1
Fig. 1
Computational model describing monopolar isolevel contours for potentials (A,C) and potential gradients (B,D), and effects of homogeneous (A,B) and nonhomogeneous (C,D) tissue resistivity. Left of each panel shows 3-dimensional representation of potential or gradient (light-grey), elements of model (including tubular bone surrounding scala tympani) and plane of section for contours shown at right of each panel. See text for more detailed description of model and observations. Electrical potentials and potential gradients are derived using a finite element model (Open source software freeFEM3D and Gmsh: Geuzaine and Remacle, 2007; Del Pino and Pironneau, 2007). Contour lines are spaced at 2 dB intervals in A and C and at 4 dB intervals in B and D. Small irregularities in contours shown result from boundary conditions and limited spatial resolution in model. Model dimensions, given in arbitrary units, are: radius of cylindrical scala tympani = 1.75; thickness of tubular bony wall = 0.25; radius of seven spherical electrode contacts = 0.5; axial center to center spacing of electrode contacts = 2; x-coordinate of tip of the peripheral neuronal processes = 2.25. Note that dimensions and shapes of model elements are chosen for convenience and clarity rather than anatomical accuracy.
Fig. 2
Fig. 2
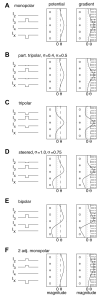
Strength of electrical potential (center column) and potential gradient (right column) predicted by the model of Fig. 1. Configurations were: monopolar (A), focused (partial) tripolar (B), tripolar (C), virtual channel using asymmetric tripole (D), bipole (E) and virtual channel using two monopoles (F). Bone resistivity was set to 10 times resistivity of perilymph and surrounding tissues, and potential and gradient strengths were evaluated at the tips of model peripheral processes (x = 2.25). Potential or gradient strength is plotted along the abscissa, and ordinate indicates axial location. Stimulus current used to compute strength in each panel was set to 6 dB above an arbitrary minimum threshold (dashed line). The total cathodic current required to reach threshold in each configuration relative to the monopolar configuration threshold was: monopolar - 1.0 (0 dB), partial tripolar - 1.3 (2.2 dB), full-tripolar - 2.2 (7.0 dB), asymmetric tripolar - 2.1 (6.6 dB), bipolar - 1.9 (5.8 dB) and two monopolar - 1.2 (1.6 dB). For reference, shaded circles represent locations of intracochlear electrodes, shaded vertical bar represents bony modiolar wall and small circles represent AN neurons.
Fig. 3
Fig. 3
Spatial response profiles showing response in the inferior colliculus to virtual channel stimuli. Successive panels show IC response rate (color) to increasingly larger total applied cathodic current. Variation along abscissa corresponds to variation of virtual channel stimulus. Diagonal trajectory of response peaks (asterisks) for currents above 0.060 mA indicates that response was evoked in regions of IC neurons that were between those evoked by single-channel stimulation (see text for details). (For interpretation of the references to color in this figure legend, the reader is referred to the web version of this article.)
Fig. 4
Fig. 4
Spatial tuning curves showing inferior colliculus response to stimulation using several values of tripolar compensation. Tripolar compensation factor is indicated at top left of each panel; 1.0 corresponds to full-tripolar stimulation (no extracochlear electrode current) using intracochlear electrodes #2, 3 and 4, 0.0 corresponds to monopolar stimulation using electrode #3. Red circles indicate current and IC depth for threshold level response. Vertical red lines indicate extent of response along tonotopic axis for stimulation 2 dB above minimum threshold, and demonstrate that spread of response along tonotopic axis evoked by more monopolar stimulation is greater (see text for details). The all-blue rows at top and bottom of each panel, beyond the physical ends of the 1.5 mm recording probe, were included to limit width calculations and do not represent measured data. Note that the range of stimulus current represented along abscissa is not identical for all panels. Color scale same as in Fig. 3. (For interpretation of the references to color in this figure legend, the reader is referred to the web version of this article.)
Fig. 5
Fig. 5
The average difference between forward masked thresholds for partial tripolar and monopolar maskers as a function of the masker-to-probe electrode displacement. The two curves show data for two different tripolar compensation coefficients σ [0.625 (diamond), and 0.75 and 0.875 (square)]. The error bars indicate the standard deviation of the data. Different subjects were used for the two curves. Although specific significance tests are difficult to apply with a small sample, it appears that on average there is a significant elevation of the masked thresholds for the tripolar stimulation.

References

    1. Abbas PJ, Hughes ML, Brown CJ, Miller CA, South H. Channel interaction in cochlear implant users evaluated using the electrically evoked compound action potential. Audiol. Neurootol. 2004;9:203–213. - PubMed
    1. Bierer JA. Threshold and channel interaction in cochlear implant users: evaluation of the tripolar electrode configuration. J. Acoust. Soc. Am. 2007;121:1642–1653. - PubMed
    1. Bierer JA, Middlebrooks JC. Auditory cortical images of cochlear-implant stimuli: dependence on electrode configuration. J. Neurophysiol. 2002;87:478–492. - PubMed
    1. Bierer JA, Middlebrooks JC. Cortical responses to cochlear implant stimulation: channel interactions. J. Assoc. Res. Otolaryngol. 2004;5:32–48. - PMC - PubMed
    1. Black RC, Clark GM. Differential electrical excitation of the auditory nerve. J. Acoust. Soc. Am. 1980;67(3):868–874. - PubMed

Publication types