Comparative Study
. 2008 Dec;12(6):752-63.
doi: 10.1016/j.media.2008.03.007. Epub 2008 Apr 12.

Registration-based estimates of local lung tissue expansion compared to xenon CT measures of specific ventilation

Affiliations
Comparative Study

Registration-based estimates of local lung tissue expansion compared to xenon CT measures of specific ventilation

Joseph M Reinhardt et al. Med Image Anal. 2008 Dec.

Abstract

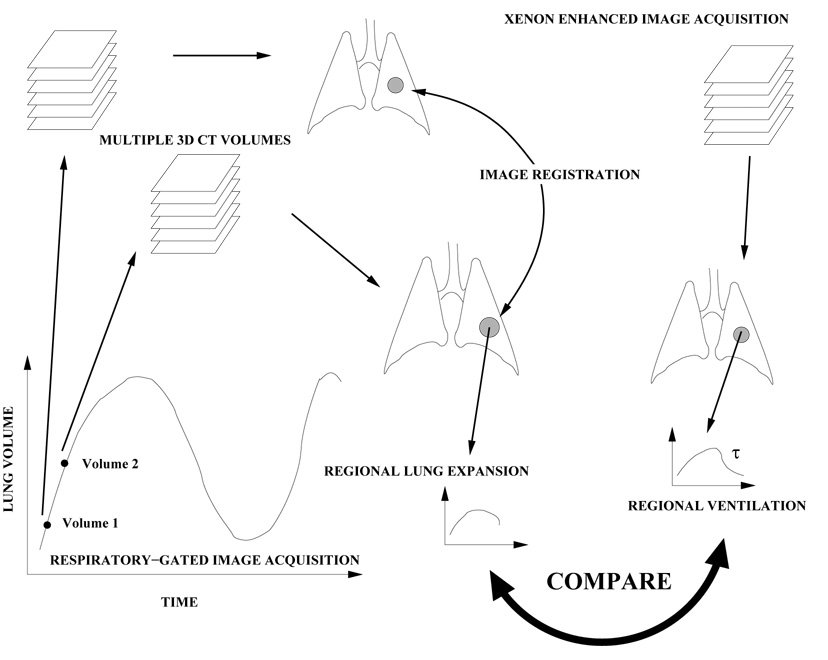
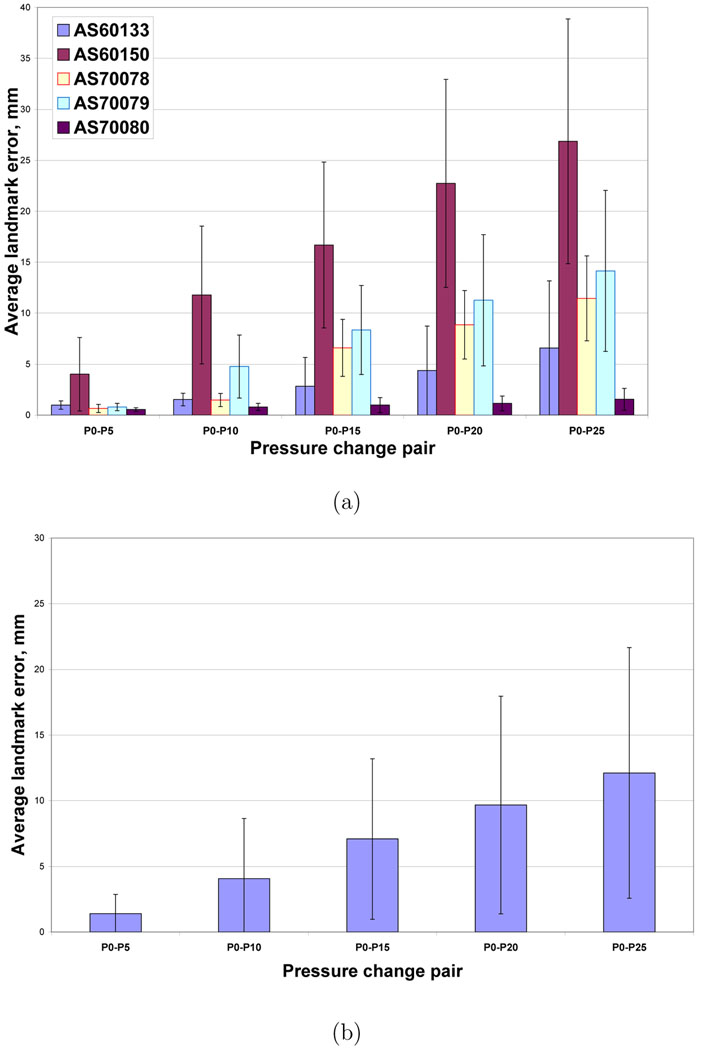
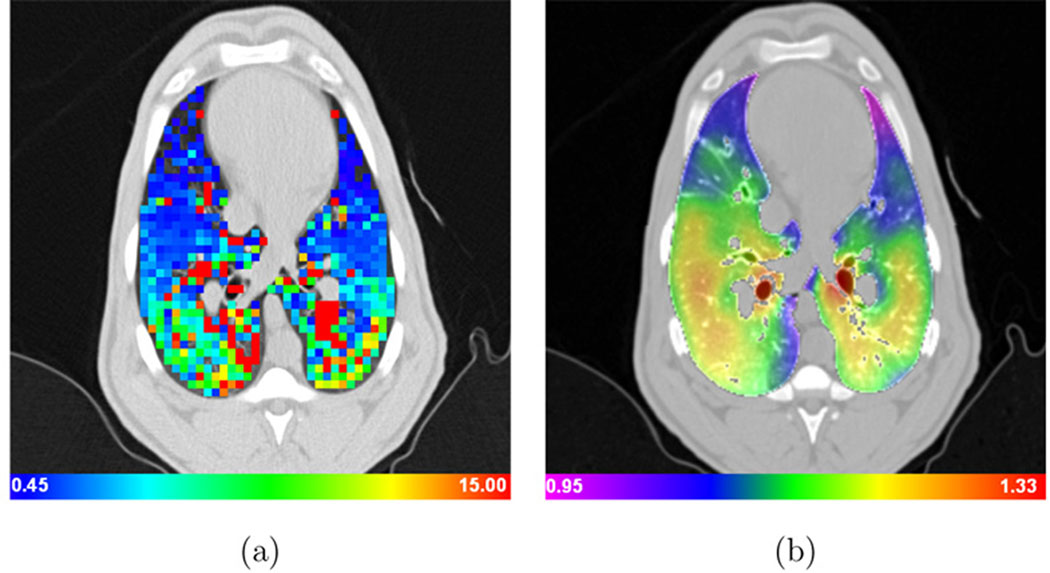
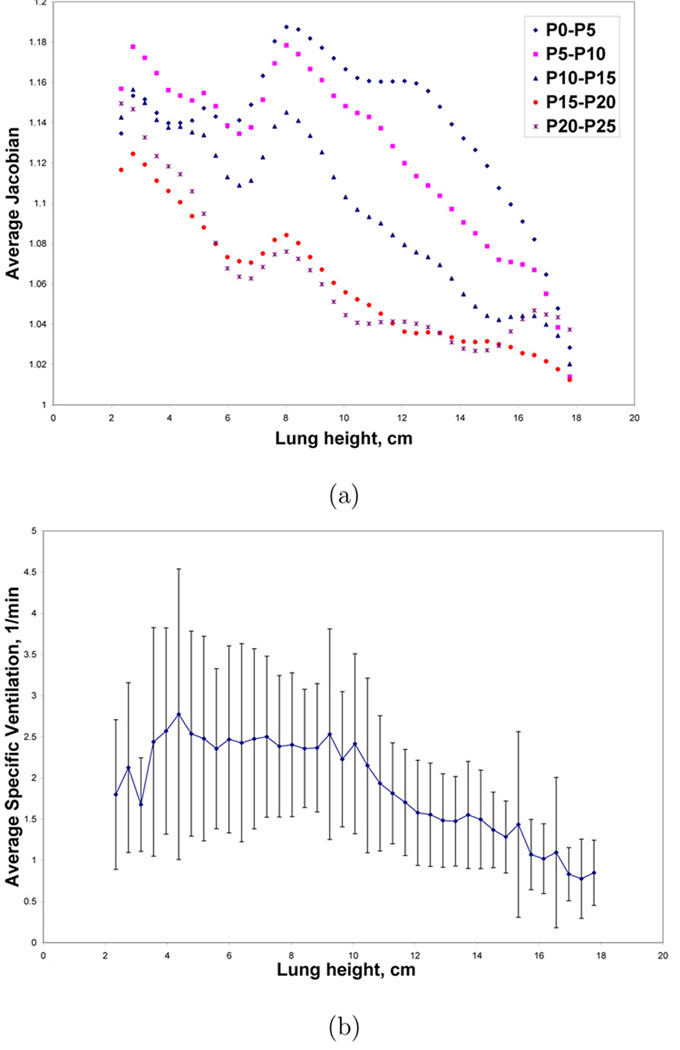
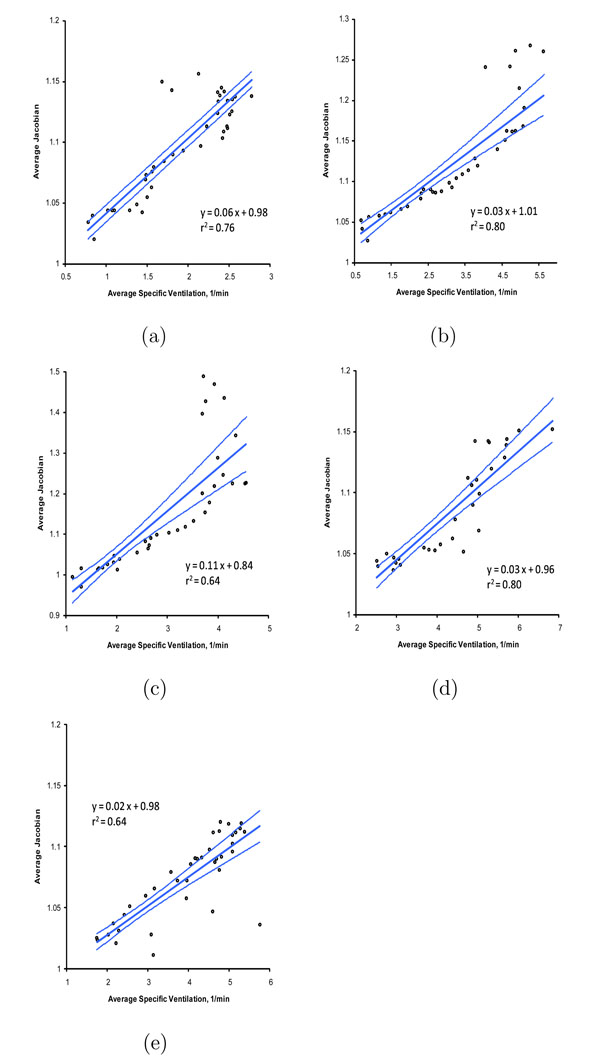
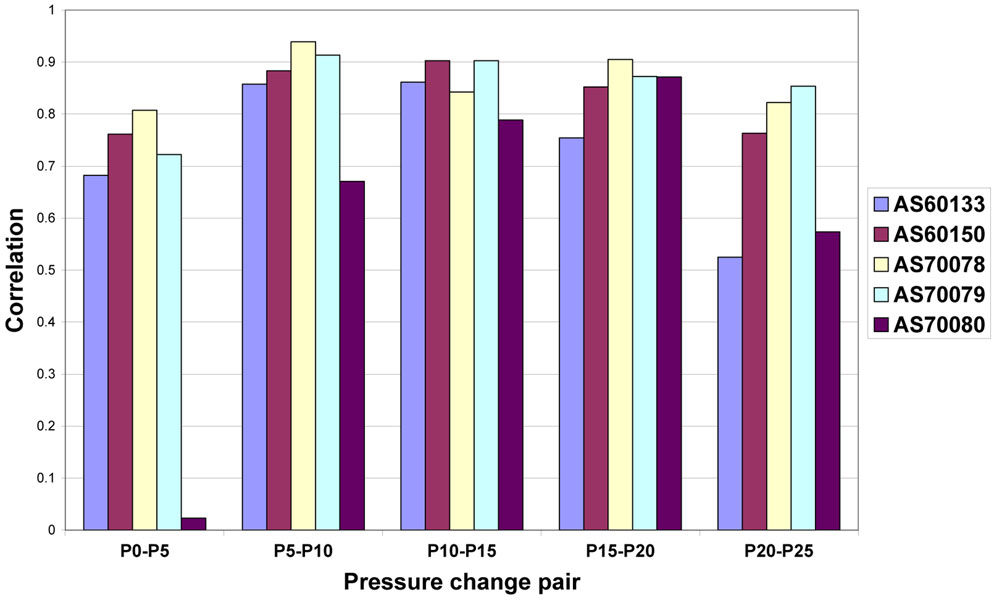
The main function of the respiratory system is gas exchange. Since many disease or injury conditions can cause biomechanical or material property changes that can alter lung function, there is a great interest in measuring regional lung ventilation and regional specific volume change. We describe a registration-based technique for estimating local lung expansion from multiple respiratory-gated CT images of the thorax. The degree of regional lung expansion is measured using the Jacobian (a function of local partial derivatives) of the registration displacement field, which we show is directly related to specific volume change. We compare the ventral-dorsal patterns of lung expansion estimated across five pressure changes to a xenon CT based measure of specific ventilation in five anesthetized sheep studied in the supine orientation. Using 3D image registration to match images acquired at 10 cm H(2)O and 15 cm H(2)O airway pressures gave the best match between the average Jacobian and the xenon CT specific ventilation (linear regression, average r(2)=0.73).


Figures

Fig. 1
Fig. 1
Multiple volumetric CT images (in this case images at volume 1 and volume 2) are acquired at two different points in the respiratory cycle and analyzed to compute a voxel-by-voxel transformation from one image to another. The Jacobian of the transformation is used to estimate regional lung expansion. Xenon-enhanced CT imaging is used to estimate local time constants associated with ventilation. We compare the registration-derived measure of lung expansion with the xenon-based estimate of regional ventilation.
Fig. 2
Fig. 2
A grayscale window and level transformation maps the CT values in Hounsfield units to 8-bit unsigned integers prior to registration. (a) Original CT data. (b) After conversion to 8-bit.
Fig. 3
Fig. 3
Wash-in and wash-out behaviors predicted by compartment model for t0 = 5 seconds, τ = 10 seconds, D0= −620 HU, and Df = −540 HU.
Fig. 4
Fig. 4
Time series data from Xe-CT study. (a) shows the Xe-CT image of the lungs, with the lung boundaries marked in blue and a rectangular region of interest in yellow. (b) shows the raw time series data for this region of interest (wash-in phase) and the associated exponential model fit.
Fig. 5
Fig. 5
Definition of the 3D region of interest for the Jacobian analysis. Image shows a sagittal slice with spatially-encoded color map that defines ventral-dorsal regions of interest. (a) P0 image shows the initial 3D rectangular region of interest. Subsequent images show how the region deforms as the lung expands. (b) P5 image; (c) P10 image; (d) P15 image; (e) P20 image; (f) P25 image.
Fig. 6
Fig. 6
Visual assessment of registration accuracy. (a) P0 image. (b) P25 image. (c) P0 image transformed to match the P25 image. (d) difference between P0 and P25 images. (e) difference between P25 and P0 transformed to match P25. Note that since (a) and (b) have different percent air content, the difference image (e) will never be exactly zero.
Fig. 7
Fig. 7
Manually-selected landmark locations projected onto (a) a coronal slice and (b) a sagittal slice for one animal at 25 cm H2O airway pressure.
Fig. 8
Fig. 8
Registration accuracy for the 5 cm H2O pressure change pairs. (a) Mean of landmark errors for each of the animals for each of the pressure change pairs. (b) Mean ± standard deviation of landmark errors for each of the pressure change pairs averaged across all animals.
Fig. 9
Fig. 9
Registration accuracy vs. increasing pressure change step size. (a) Mean of landmark errors for each of the animals for each of the pressure change pairs. (b) Mean ± standard deviation of landmark errors for each of the pressure change pairs averaged across all animals.
Fig. 10
Fig. 10
Color-coded maps showing (a) specific ventilation (1/min) and (b) the Jacobian of the image registration transformation (unitless) for approximately the same anatomic slice computed from the P5–P10 image pair. Note that the physical units and color scales are different for (a) and (b). Dark blue regions on the specific ventilation image (a) are regions that have low ventilation while green and yellow regions have higher ventilation; Bright red and orange regions on the Jacobian image (b) have large lung deformation while blue and purple regions are deforming less.
Fig. 11
Fig. 11
Example Jacobian and sV measurements vs. lung height for one animal. (a) Average Jacobian values for all pressure pairs vs. lung height; and (b) average ± standard deviation of sV vs. lung height. Error bars are not shown for the Jacobian data, however, the coefficient of variation is less than 10% of the average value.
Fig. 12
Fig. 12
Scatter plots of average sV and average Jacobian for the P10 to P15 pressure change pair for (a) animal AS60133; (b) animal AS60150; (c) animal AS70078; (d) animal AS70079; (e) animal AS70080. Linear regression lines and 95% confidence bands are shown. Regression parameters are given in Table 1.
Fig. 13
Fig. 13
Correlation coefficients r from the linear regression of average Jacobian and sV for each 5 cm H2O pressure change pair and for each animal.

References

    1. Altes TA, Mata J, de Lange EE, Brookeman JR, Mugler JP. Assessment of lung development using hyperpolarized helium-3 diffusion MR imaging. Journal of magnetic resonance imaging : JMRI. 2006;24(6):1277–1283. - PubMed
    1. Analyse-It. Analyse-it for Microsoft Excel (version 2.07) Analyse-it Software, Ltd.; 2008. http://www.analyse-it.com/.
    1. Bunow B, Line B, Horton M, Weiss G. Regional ventilatory clearance by xenon scintigraphy: A critical evaluation of two estimation procedures. J. Nucl. Med. 1979;20(7):703–710. - PubMed
    1. Chon D, Beck KC, Simon BA, Shikata H, Saba OI, Hoffman EA. Effect of low-xenon and krypton supplementation on signal/noise of regional CT-based ventilation measurements. J. Applied Physiology. 2007;102:1535–1544. - PubMed
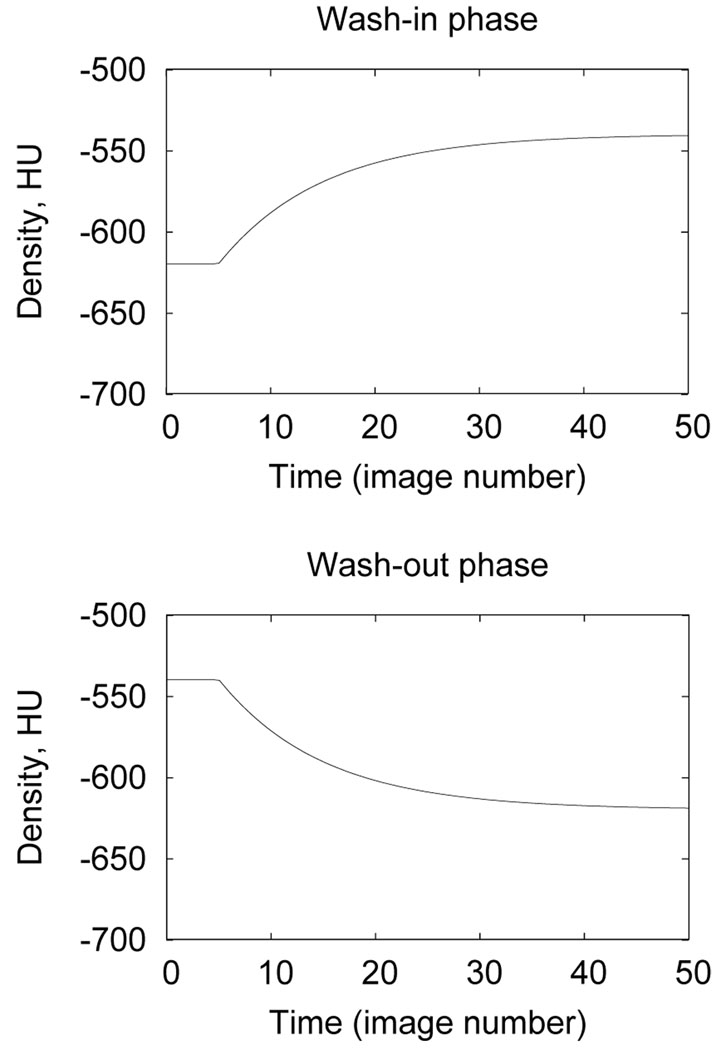
    1. Chon D, Simon BA, Beck KC, Shikata H, Saba OI, Won C, Hoffman EA. Differences in regional wash-in and wash-out time constants for xenon-CT ventilation studies. Respiratory Physiology & Neurobiology. 2005;148:65–83. - PubMed

Publication types