. 2008 Jun 27:1217:185-94.
doi: 10.1016/j.brainres.2008.03.060. Epub 2008 Apr 7.

Dystrophic serotonergic axons in neurodegenerative diseases

Affiliations

Dystrophic serotonergic axons in neurodegenerative diseases

Efrain C Azmitia et al. Brain Res. .

Abstract

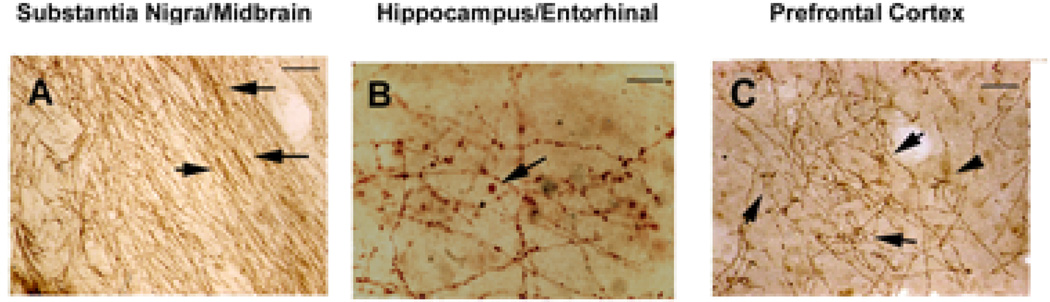
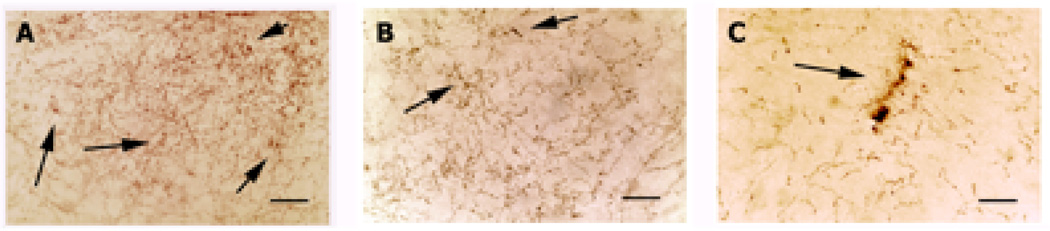
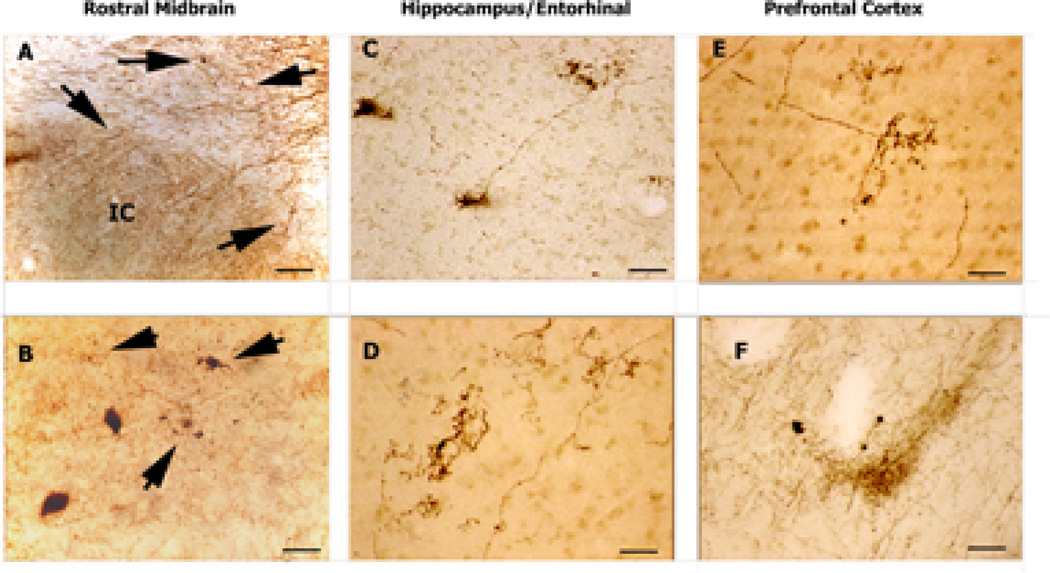
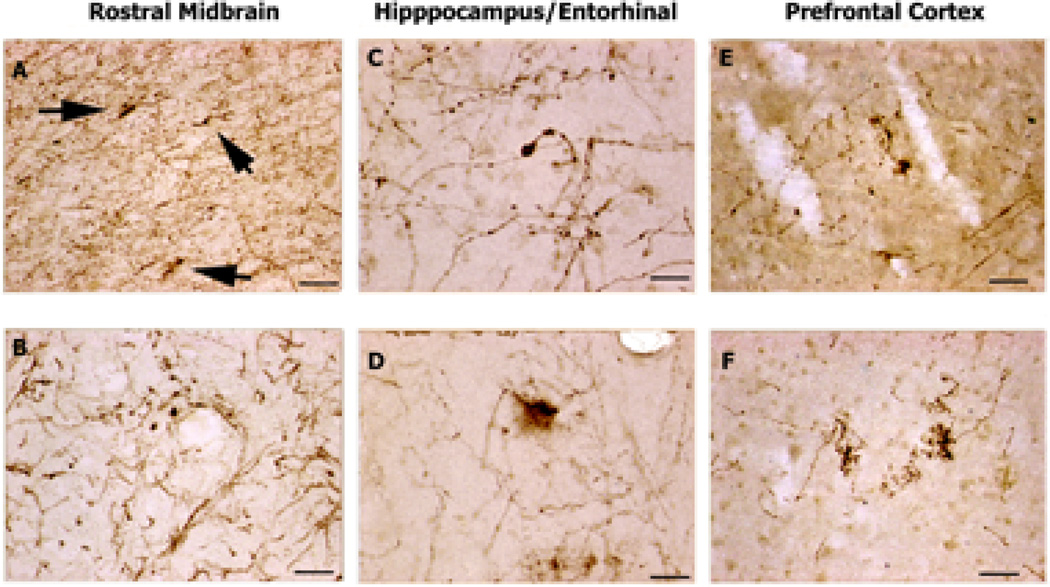
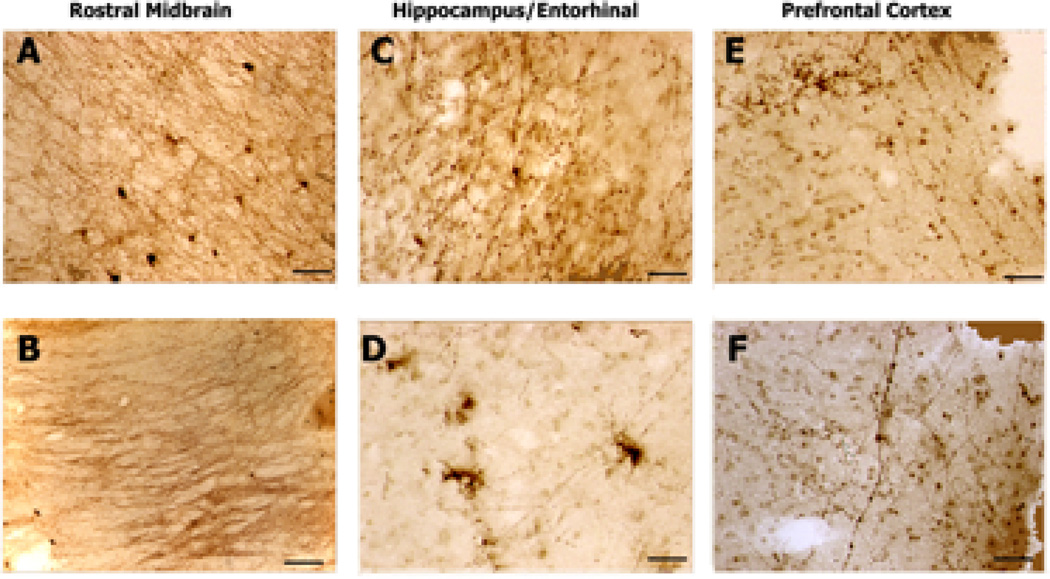
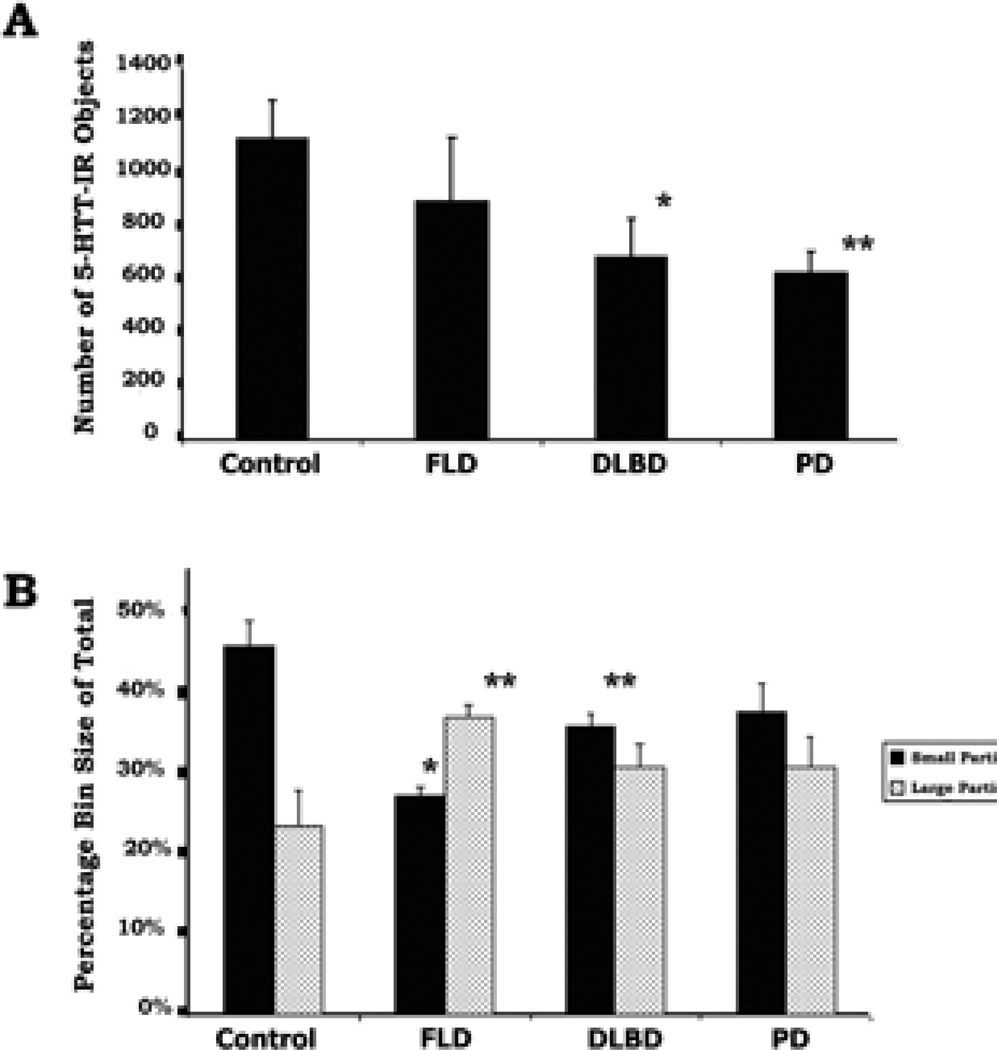
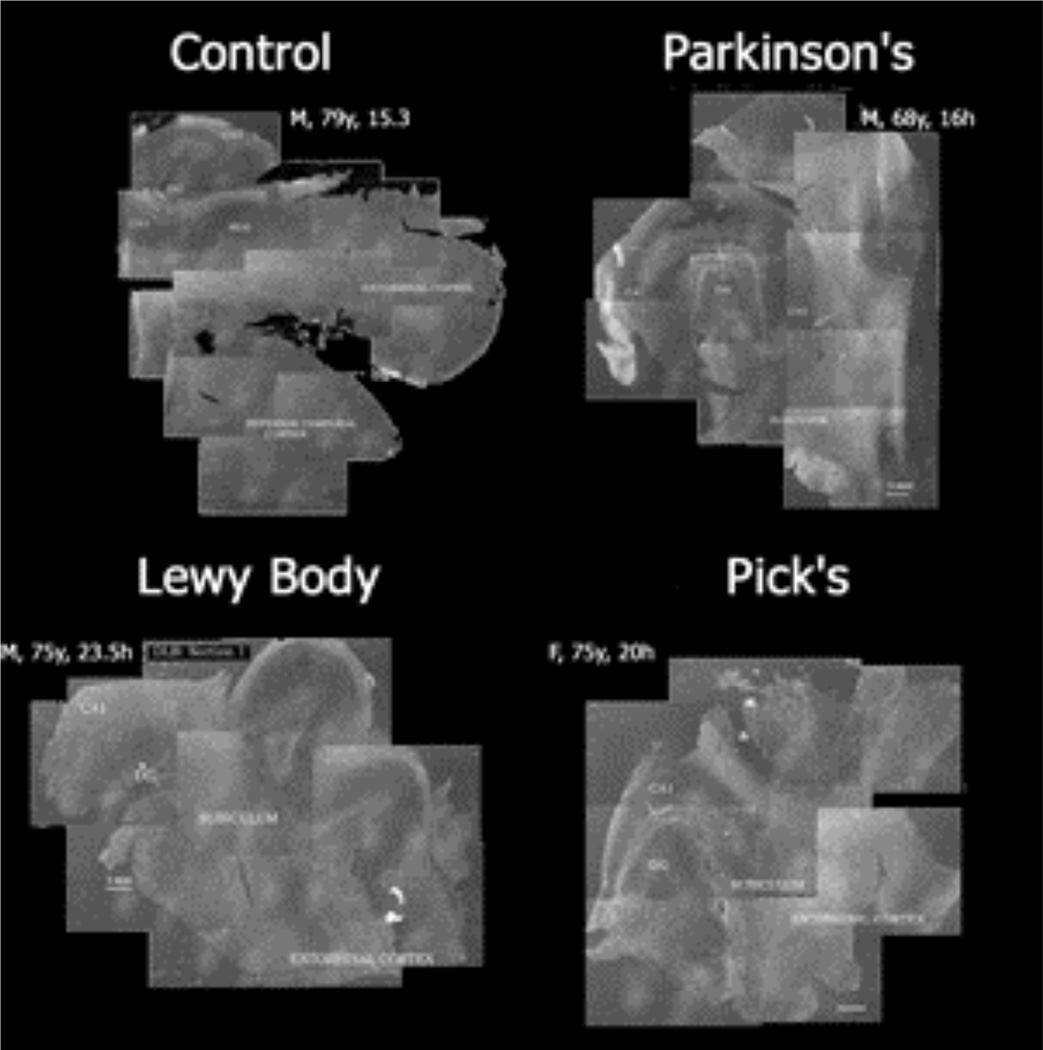
Neurodegenerative diseases such as Parkinson's disease (PD), frontal lobe dementia (FLD) and diffuse Lewy-body dementia (DLBD) have diverse neuropathologic features. Here we report that serotonin fibers are dystrophic in the brains of individuals with these three diseases. In neuropathologically normal (control) brains (n=3), serotonin axons immunoreactive (IR) with antibodies against the serotonin transporter (5-HTT) protein were widely distributed in cortex (entorhinal and dorsolateral prefrontal), hippocampus and rostral brainstem. 5-HTT-IR fibers-of-passage appeared thick, smooth, and unbranched in medial forebrain bundle, medial lemniscus and cortex white matter. The terminal branches were fine, highly branched and varicose in substantia nigra, hippocampus and cortical gray matter. In the diseased brains, however, 5-HTT-IR fibers in the forebrain were reduced in number and were frequently bulbous, splayed, tightly clustered and enlarged. Morphometric analysis revealed significant differences in the size distribution of the 5-HTT-IR profiles in dorsolateral prefrontal area between neurodegenerative diseases and controls. Our observations provide direct morphologic evidence for degeneration of human serotonergic axons in the brains of patients with neurodegenerative diseases despite the limited size (n=3 slices for each region (3) from each brain (4), total slices was n=36) and the lack of extensive clinical characterization of the analyzed cohort. This is the first report of dystrophic 5-HTT-IR axons in postmortem human tissue.


Figures

Figure 1
Figure 1. 5-HTT-IR axons in control brain
5-HTT-IR axons are seen in brains from control individuals. A. In the midbrain/substantia nigra sections heavy fiber labeling is seen in the medial lemniscal with the fibers throughout the entire pathway. These fibers of passage have small varicosities and often form tight bundles (arrows). Scale bar is 200µm. B. In the hippocampus and entorhinal areas the 5-HTT-IR axons are forming terminal boutons. In these sections larger boutons can be seen (arrow). Scale bar is 50µm. C. In the prefrontal cortex, the 5-HTT-IR fibers form clusters around cell bodies in pyramidal layers (arrows). Scale bar is 200µm.
Figure 2
Figure 2. Rare 5-HTT-IT axons in a control 79 year old brain
Dystrophic 5-HTT-IR axons are seen, but infrequently, in the brain of a control 79-year-old-male. A. Layer III of entorhinal cortex is heavily innervated with 5-HTT-IR axons. Among the normal fibers, abnormal fibers can be seen forming dense clusters, which can condense into a larger degenerating profile (arrows). B. In the polymorphic area of the DG abnormally large varicosities can be found (arrow). C. In the dendritic region of CA3 degenerating profiles are seen among normal fibers. Scale bar is 50µm in all panels.
Figure 3
Figure 3. 5-HTT-IR Axons in Diffuse Lewy Body Brain
5-HTT-IR axons in brains from patients diagnosed with Diffuse Lewy-Body Dementia. A. This picture shows normal appearing 5-HTT-IR axonal bundles in the dorsal aspect of the section just above the inferior colliculus (IC). There is evidence of dystrophic 5-HTT-IR axons in the fiber bundles (arrows). Scale bar is 200µm. B. Normal and abnormal (arrows) terminals in the substantia nigra. Two pigmented nigra neurons can be seen. Scale bar is 50µm. C. Splayed 5-HTT-IR terminals seen in CA3 dendritic region. Scale bar is 50µm. D. Tight clusters of 5-HTT-IR axons in Layer III of entorhinal cortex. The number of labeled fibers is reduced in this region. Scale bar is 50µm. E. Tight cluster of 5-HTT-IR fibers in Layer III of prefrontal cortex. Scale bar is 50µm. F. In deep layers of cortex, aggregates of fibers are found among dystrophic 5-HTT-IR axons with enlarged varicosities. Scale bar is 200µm.
Figure 4
Figure 4. 5-HTT-IR Axons in Parkinson' Disease Donor Brain
5-HTT-IR axons in brains from patients diagnosed with Parkinson’s disease. A. 5-HTT-IR axons in the red nucleus show some abnormal fibers (arrows) among many normal fibers. Scale bar is 200µm. B. In midline areas 5-HTT-IR fibers with enlarged varicosities are found among normal fibers. Scale bar is 50µm. C. Dystrophic 5-HTT-IR axons with enlarged varicosity in the dendritic regions of CA1. Scale bar is 50µm. D. Dystrophic 5-HTT-IR axons are splayed and degenerating in the upper layers of the entorhinal cortex. Scale bar is 50µm. E. Fine degenerating 5-HTT-IR axons in the upper layer of prefrontal cortex. Scale bar is 50µm. F. Fine, dense clusters of 5-HTT-IR axons in the deeper layers of prefrontal cortex. Scale bar is 50µm.
Figure 5
Figure 5. 5-HTT-IR Axons in Frontal Lobe Dementia
5-HTT-IR axons in brains from patients diagnosed with Frontal Lobe Dementia. A. Dense innervation by 5-HTT-IR fibers is seen in the substantia nigra nucleus. No dystrophic 5-HTT-IR fibers seen. Scale bar is 200µm. B. Heavy labeling of the fibers in the medial lemniscal tract. No dystrophic 5-HTT-IR fibers seen. Scale bar is 200µm. C. Enlarged varicosities seen in hilus area of dentate gyrus. Scale bar is 50µm. D. Several splayed and degenerating 5-HTT-IR terminals seen in the upper layer of entorhinal cortex. Note reduced appearance of normal 5-HTT-IR fibers. Scale bar is 50µm. E. Dense clustering and aggregation of 5-HTT-IR axons in layer II–III of the prefrontal cortex. Note normal tangential fibers in layer I. Scale bar is 50µm. F. Enlarged 5-HTT-IR axons are seen in the deeper layers of prefrontal cortex. 5-HTT-IR axonal innervation appears reduced from normal. Scale bar is 50µm.
Figure 6
Figure 6. Morphometric Analysis of 5-HTT-IR in Prefrontal Cortex
This figure shows the results from morphometric analysis of the labeled objects found in prefrontal cortex of control and diseased brains using threshold setting of immunoreactive density. A. The total number of particles (varicosities, fibers and degenerating axons) was counted in an area of 0.5mm2 in layer III–V of the cortex. Each bar is the mean of three brains from each group (see Materials and Methods for details). The number of particles selected was lower for all diseased-groups compared to normal prefrontal cortex, and was significant for the DLBD and PD. B. A histogram of all particle areas was made form the particles selected for part A. The percentage of the total number of particles which had the smallest area (<10µ2) is shown in the black bars (average ± SEM) with an n=3 for all groups. The larger objects (30–75µ2) are shown in stipple. The brains from controls had a higher percentage of particles having a smaller area (varicosities and fine axons) when compared to the brains from diseased cases. By contrast, the brains from diseased cases had significantly higher percentage of particles having a larger area (large axons and degenerating profiles). *=p<.05; **=p<.01.
Figure 7
Figure 7. Dark field Montage

References

    1. Abi-Dargham A, Gandelman MS, DeErausquin GA, Zea-Ponce Y, Zoghbi SS, Baldwin RM, Laruelle M, Charney DS, Hoffer PB, Neumeyer JL, Innis RB. SPECT imaging of dopamine transporters in human brain with iodine-123-fluoroalkyl analogs of beta-CIT. J. Nucl. Med. 1966;37:1129–1133. - PubMed
    1. Allen H, Burns A. The non-cognitive features of dementia. Rev. Clin. Gerontol. 1995;5:57–75.
    1. Aucoin J, Jiang P, Aznavour N, Tong XK, Buttini M, Descarries L, Hamel E. Selective cholinergic denervation, independent from oxidative stress, in a mouse model of Alzheimer's disease. Neuroscience. 2005;132:73–86. - PubMed
    1. Austin MC, Whitehead RE, Edgar CL, Janosky JE, Lewis DA. Localized decrease in serotonin transporter-immunoreactive axons in the prefrontal cortex of depressed subjects committing suicide. Neuroscience. 2002;114:807–815. - PubMed
    1. Azmitia E, Gannon P. The ultrastructural localization of serotonin immunoreactivity in myelinated and unmyelinated axons within the medial forebrain bundle of rat and monkey. J Neurosci. 1983;3:2083–2090. - PMC - PubMed

Publication types

Substances