. 2008 Aug-Sep;29(24-25):3415-28.
doi: 10.1016/j.biomaterials.2008.05.002. Epub 2008 May 27.

In vivo degradation of three-dimensional silk fibroin scaffolds

Affiliations

In vivo degradation of three-dimensional silk fibroin scaffolds

Yongzhong Wang et al. Biomaterials. 2008 Aug-Sep.

Abstract

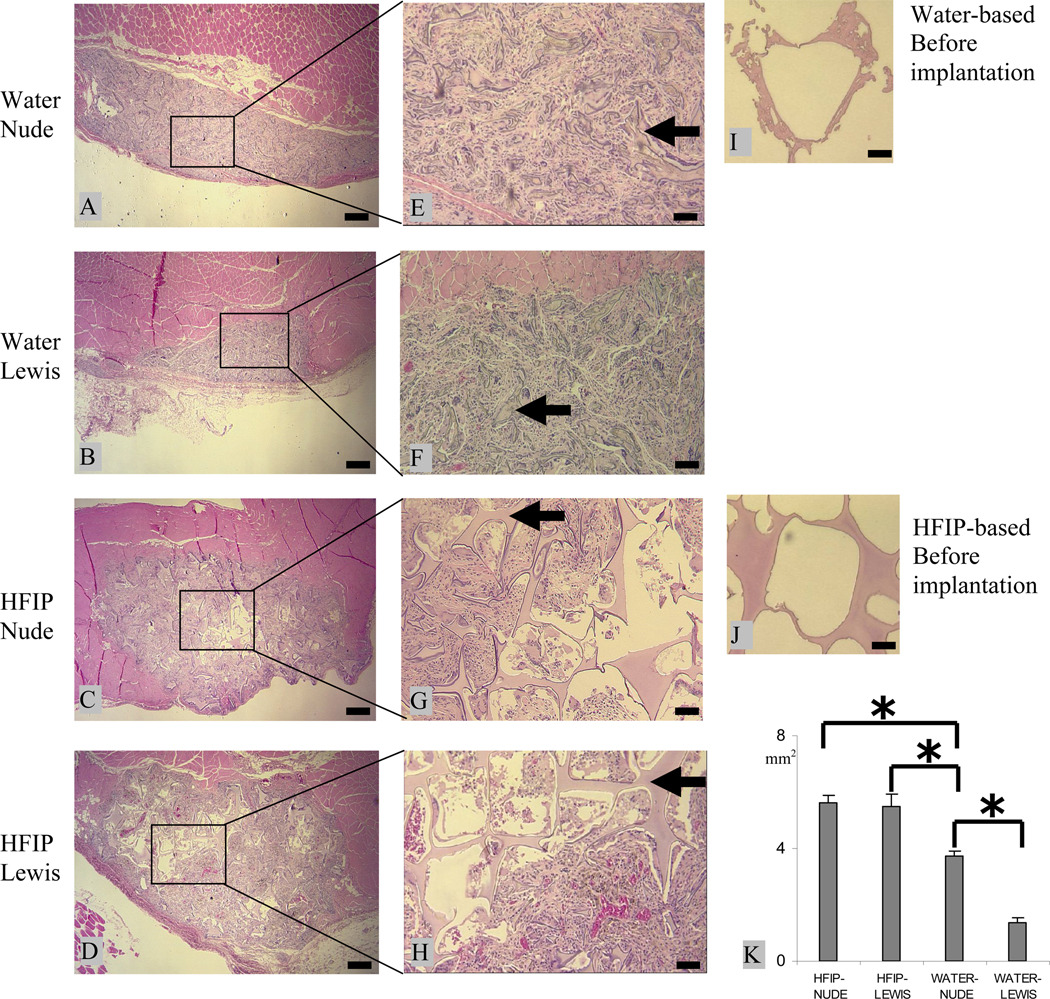
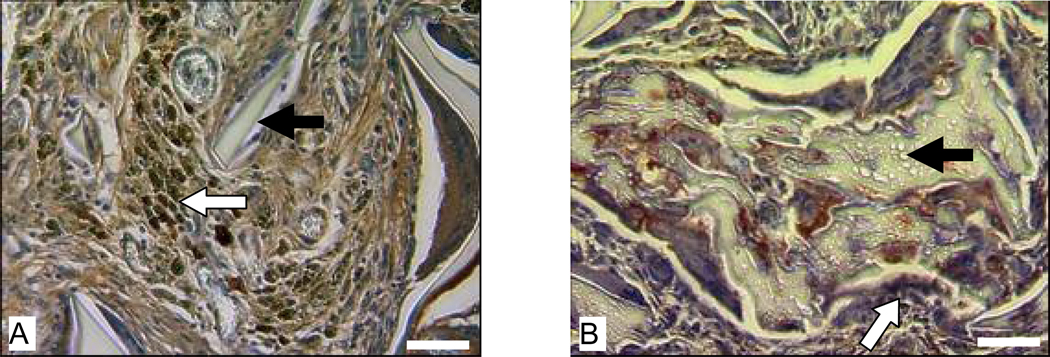
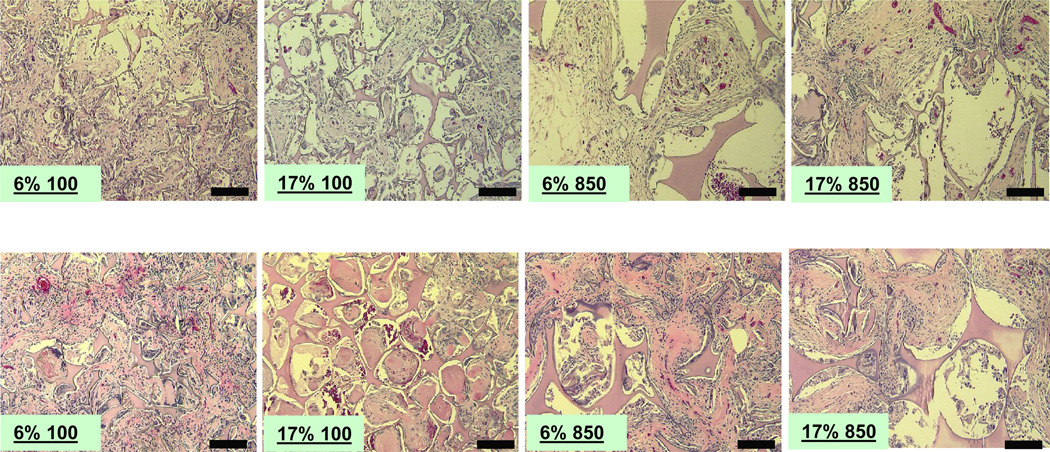
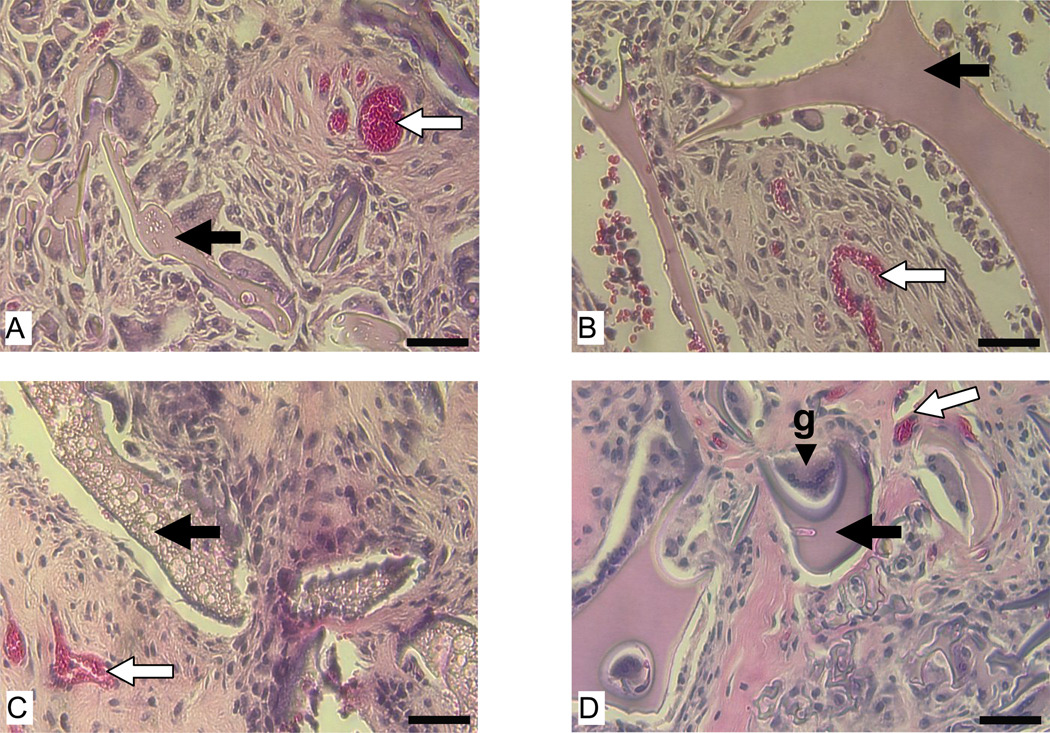
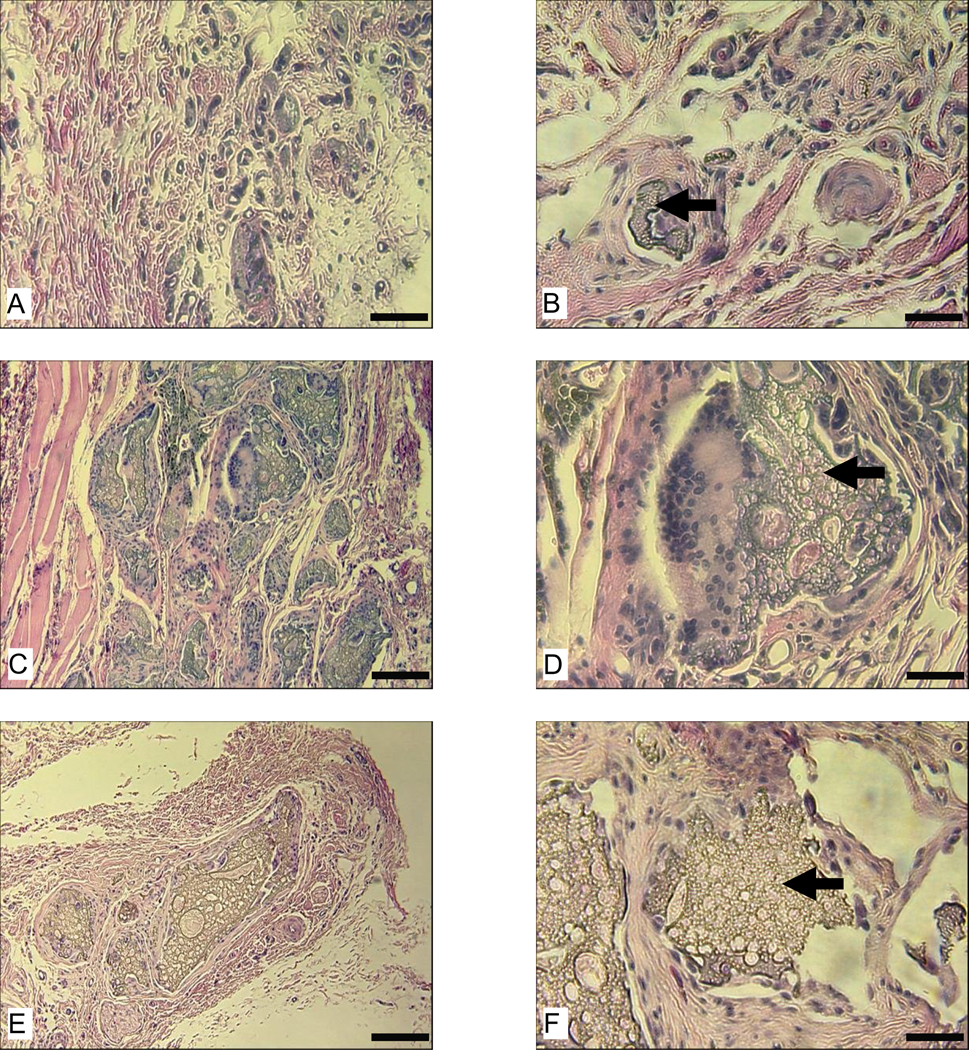
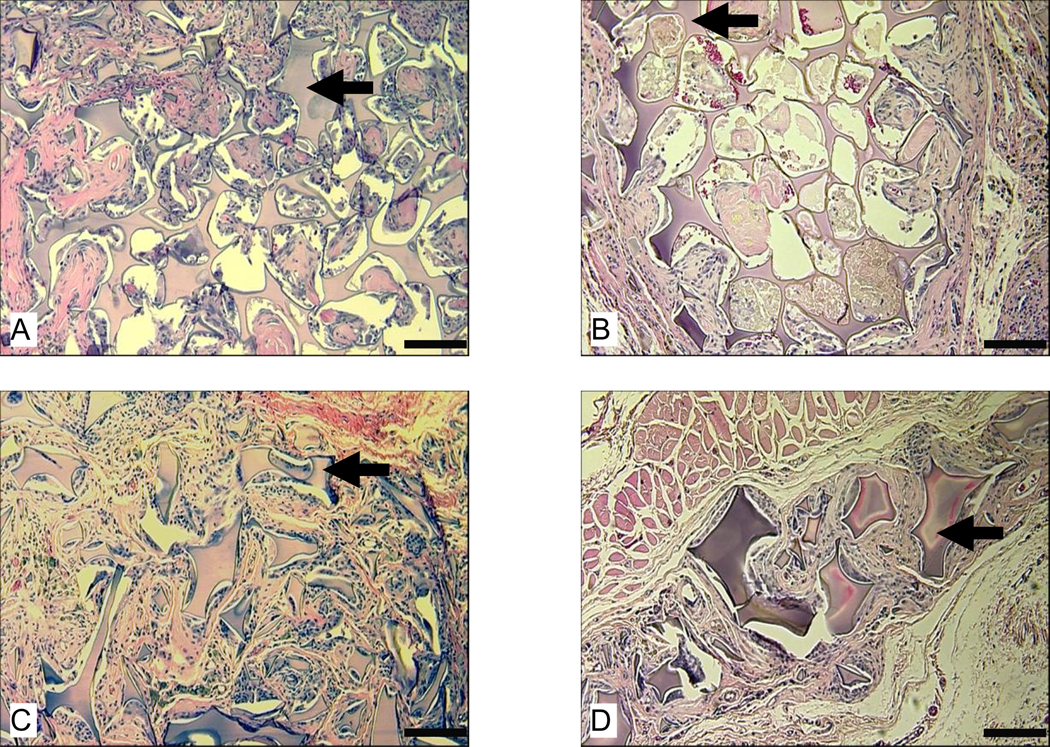
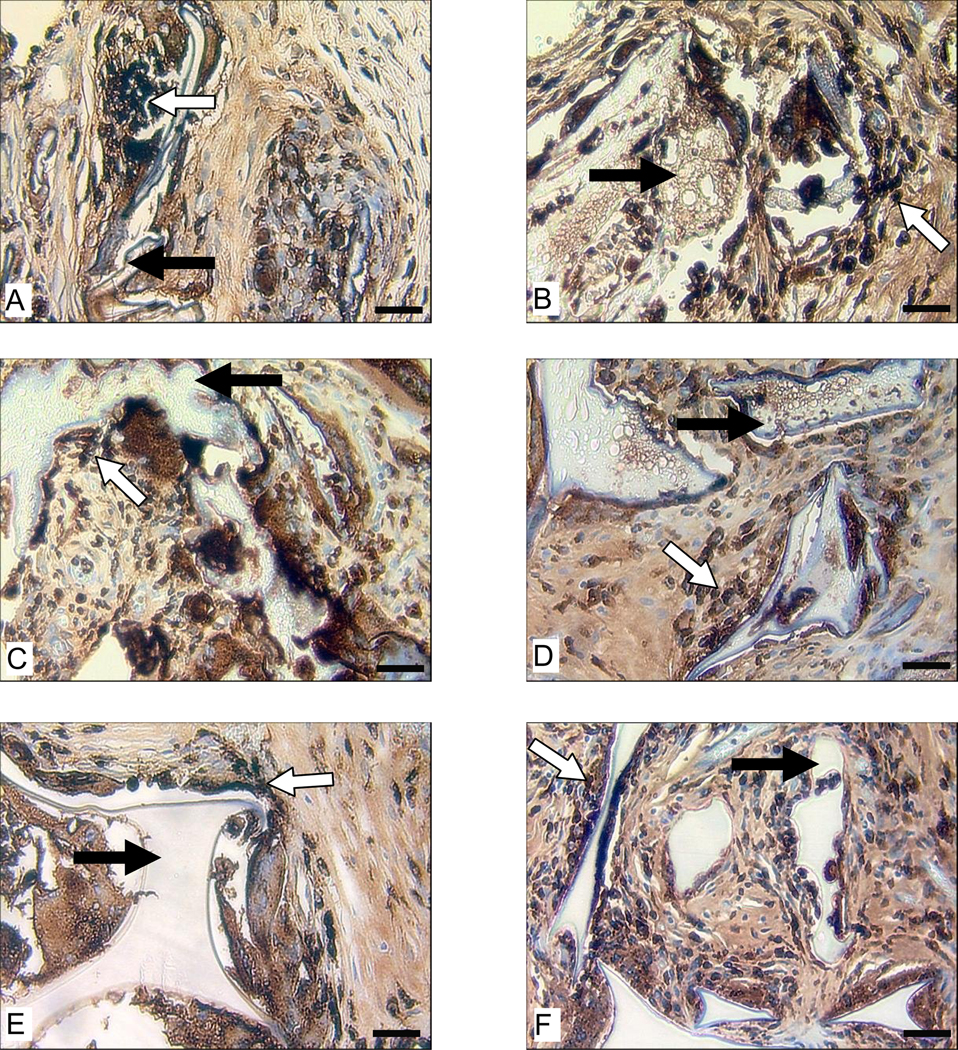
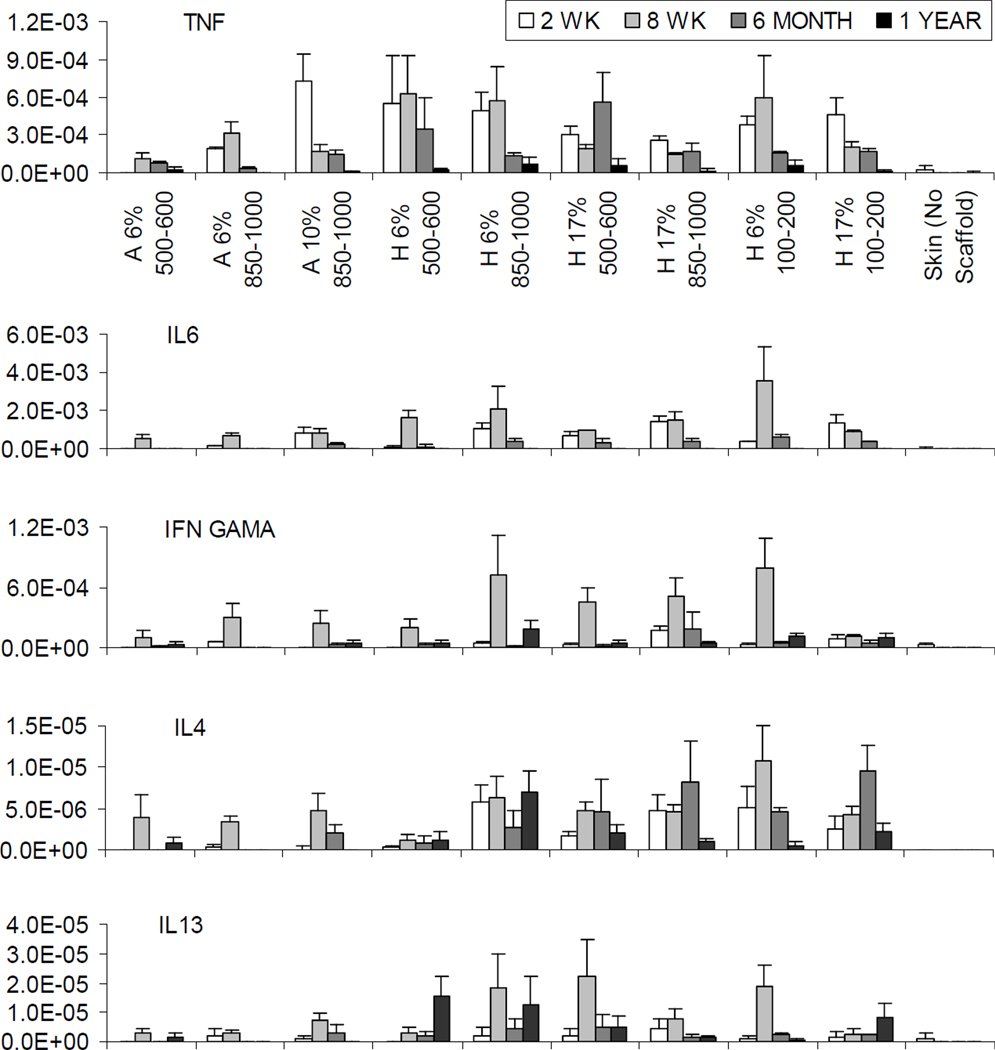
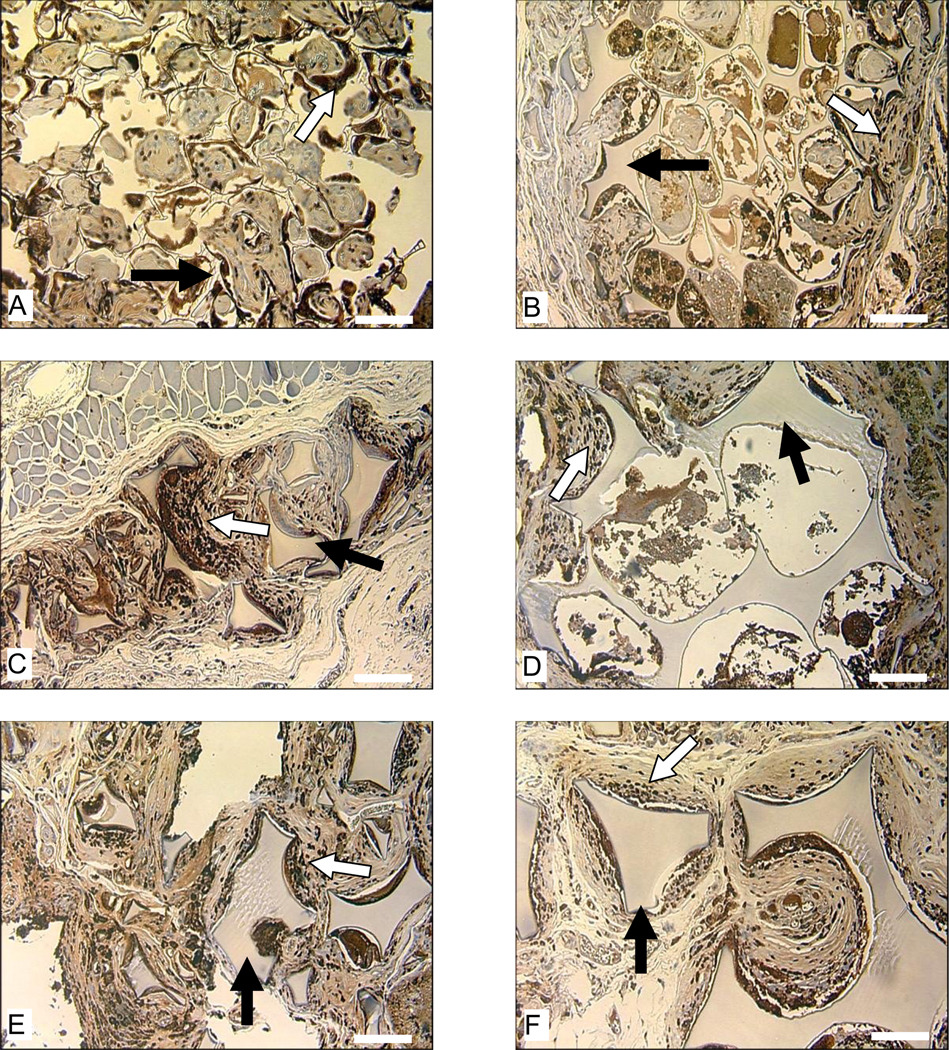
Three-dimensional porous scaffolds prepared from regenerated silk fibroin using either an all-aqueous process or a process involving an organic solvent, hexafluoroisopropanol (HFIP), have shown promise in cell culture and tissue engineering applications. However, their biocompatibility and in vivo degradation have not been fully established. The present study was conducted to systematically investigate how processing method (aqueous vs. organic solvent) and processing variables (silk fibroin concentration and pore size) affect the short-term (up to 2 months) and long-term (up to 1 year) in vivo behavior of the protein scaffolds in both nude and Lewis rats. The samples were analyzed by histology for scaffold morphological changes and tissue ingrowth, and by real-time RT-PCR and immunohistochemistry for immune responses. Throughout the period of implantation, all scaffolds were well tolerated by the host animals and immune responses to the implants were mild. Most scaffolds prepared from the all-aqueous process degraded to completion between 2 and 6 months, while those prepared from organic solvent (hexafluoroisopropanol (HFIP)) process persisted beyond 1 year. Due to widespread cellular invasion throughout the scaffold, the degradation of aqueous-derived scaffolds appears to be more homogeneous than that of HFIP-derived scaffolds. In general and especially for the HFIP-derived scaffolds, a higher original silk fibroin concentration (e.g. 17%) and smaller pore size (e.g. 100-200microm) resulted in lower levels of tissue ingrowth and slower degradation. These results demonstrate that the in vivo behavior of the three-dimensional silk fibroin scaffolds is related to the morphological and structural features that resulted from different scaffold preparation processes. The insights gained in this study can serve as a guide for processing scenarios to match desired morphological and structural features and degradation time with tissue-specific applications.


Figures

Figure 1
Figure 1
Intramuscular degradation of aqueous-(A, B, E, and F) and HFIP-(C, D, G, and H) derived silk scaffolds in nude and Lewis rats. Scaffolds were implanted for 8 weeks and stained with H&E. Original structure of the aqueous- and HFIP-derived scaffolds prior to implantation are shown in I and J, respectively. The cross-section area is shown in K. Bars in A–D = 400 µm and in E–J = 100 µm. Solid arrows = remaining scaffolds. (p<0.05)
Figure 2
Figure 2
Host response to intramuscularly implanted silk fibroin scaffolds in Lewis rats at 8 weeks. Images A and B are for HFIP-derived scaffolds and aqueous-derived scaffolds, respectively. Bars = 100 µm. Solid arrows = remaining scaffolds. Blank arrows = ED1 positive cells.
Figure 3
Figure 3
Morphologies of subcutaneously implanted aqueous-derived silk fibroin scaffolds in Lewis rats at 2 weeks (A–D) and 8 week (E–F). Images A,B, E, and F are for scaffolds with 850–1000 µm pore size prepared from 6% silk fibroin solution. Images C, D, G, and H are for scaffolds with 850–1000 µm pore size prepared from 10% silk fibroin solution. Images B, D, F, H are the enlarged views of the boxed area in Images A, C, E and G, respectively. Bars in images A, C, E, and G = 250 µm and in B, D, F, and H = 100 µm. Solid arrows in images B, D, F, and H = remaining scaffolds.
Figure 4
Figure 4
Morphologies of subcutaneously implanted HFIP-derived silk fibroin scaffolds in Lewis rats at 2 (top row) and 8 weeks (bottom row). Labels in all images describe the original silk fibroin concentration followed by pore size. Due to limitation in space, pore sizes “100” and “850” in the labels refer to 100 – 200 µm and 850 – 1000 µm, respectively. Bars = 100 µm.
Figure 5
Figure 5
Vascularization of subcutaneously implanted aqueous and HFIP-derived silk fibroin scaffolds in Lewis rats at 2 and 8 weeks. Images A and C are for aqueous-derived scaffolds at 2 and 8 weeks, respectively. Images B and D are for HFIP-derived scaffolds at 2 and 8 weeks, respectively. Bars= 100 µm. Solid arrows = remaining scaffolds. Blank arrows = signs of vascularization. Abbreviation “g” in image D = giant cell.
Figure 6
Figure 6
Morphologies of subcutaneously implanted aqueous-derived silk fibroin scaffolds at 6 and 12 months. Images A and B show the only remaining scaffold prepared from 6% silk fibroin solution with 500 – 600 µm pore size at 6 and 12 months, respectively. Images C and D show the remaining scaffolds prepared from 10% silk fibroin solution with 850 – 1000 µm pore size at 6 months at 10X and 32X, respectively. Images E and F show the remaining scaffolds prepared from 10% silk fibroin solution with 850 – 1000 µm pore size at 12 months at 10X and 32X, respectively. Bars in A, B, D, and F = 100 µm and in C and E = 300 µm. Solid arrows = remaining scaffolds.
Figure 7
Figure 7
Morphologies of subcutaneously implanted HFIP-derived silk fibroin scaffolds at 6 and 12 months. Images A and B are for HFIP-derived scaffolds prepared from 17% silk fibroin solution with 100 – 200 µm pore size at 6 months and 12 months, respectively. Images C and D are for HFIP-derived scaffolds prepared from 6% silk fibroin solution with 500 – 600 µm pore size at 6 and 12 months, respectively. Bars = 100 µm. Solid arrows = remaining scaffolds.
Figure 8
Figure 8
Macrophage response to subcutaneously implanted scaffolds in Lewis rats. Images A and B are for aqueous-derived silk fibroin scaffolds prepared from 6% and 10% silk fibroin solution at 2 weeks, respectively. Images C and D are for aqueous-derived silk fibroin scaffolds prepared from 6% and 10% silk fibroin solution at 8 weeks, respectively. Images E and F are for HFIP-derived silk fibroin scaffolds prepared from 6% silk fibroin solution at 2 (E) and 8 weeks (F). The pore size of all scaffolds is 850–1000 µm. Bars = 100 µm. Solid arrows = remaining scaffolds. Blank arrows = ED1 positive cells.
Figure 9
Figure 9
The relative expression level for TNF-α, IL6, IFN-γ, IL4, and IL13 mRNAs at 2 weeks, 8 weeks, 6 months and 12 months. Labels for X axis: “A” for aqueous and “H” for HFIP. For examples, “A 6% 500–600” represents aqueous-derived scaffolds with 500–600 µm pore size prepared from 6 % silk fibroin solution, while “H 6% 500–600” represents HFIP-derived scaffolds with 500–600 µm pore size prepared from 6 % silk fibroin solution. Y axis = relative expression level normalized to GAPDH. The missing bars in the graphs at varying timepoints indicate relative expression levels were not detectable.
Figure 10
Figure 10
Morphologies of and macrophage responses to subcutaneously implanted silk fibroin scaffolds in Lewis rats at 6 months (A and B) and 12 months (C and D). Image A is for aqueous-derived scaffold with 850–1000 µm pore size prepared from 10% silk fibroin solution. Image B is for HFIP-derived scaffold with 500–600 µm pore size prepared from 6% silk fibroin solution. Images C and D are for aqueous-derived scaffold with 500–600 µm pore size prepared from 6% silk fibroin solution and with 850–1000 µm pore size prepared from 10% silk fibroin solution, respectively. Bars in A and B = 100 µm and in C and D = 300 µm. Solid arrows = remaining scaffolds. Blank arrows = ED1 positive cells.
Figure 11
Figure 11
Macrophage response to subcutaneously implanted HFIP-derived silk fibroin scaffolds in Lewis rats at the end of 12 months. Images A, C, and E are for scaffolds prepared from 6% silk fibroin solution. Images B, D, and F are for scaffolds prepared from 17% silk fibroin solution. Pore size in Images A and B is 100–200 µm, in C and D is 500–600 µm, and in E and F is 850–1000 µm. Bars = 100 µm. Solid arrows = remaining scaffolds. Blank arrows = ED1 positive cells.

References

    1. Kaplan D, Adams WW, Farmer B, Viney C. Silk - Biology, Structure, Properties, and Genetics. Acs Sym Ser. 1994;544:2–16.
    1. Kaplan DL, Mello CM, Arcidiacono S, Fossey S, Senecal K, Muller W. Silk. In: McGrath K, Kaplan DL, editors. Protein based materials. Boston: Birkhauser; 1998. pp. 103–131.
    1. Vollrath F, Knight DP. Liquid crystalline spinning of spider silk. Nature. 2001;410(6828):541–548. - PubMed
    1. Winkler S, Kaplan DL. Molecular biology of spider silk. J Biotechnol. 2000;74(2):85–93. - PubMed
    1. Wong Po Foo C, Kaplan DL. Genetic engineering of fibrous proteins: spider dragline silk and collagen. Adv Drug Deliv Rev. 2002;54(8):1131–1143. - PubMed

Publication types

MeSH terms