. 2008 Aug;95(4):1993-2008.
doi: 10.1529/biophysj.108.132233. Epub 2008 May 23.

Microtubule assembly of isotypically purified tubulin and its mixtures

Affiliations

Microtubule assembly of isotypically purified tubulin and its mixtures

Vahid Rezania et al. Biophys J. 2008 Aug.

Abstract

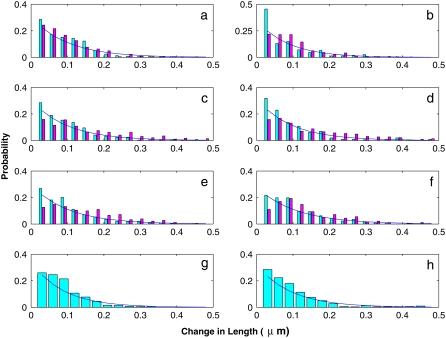
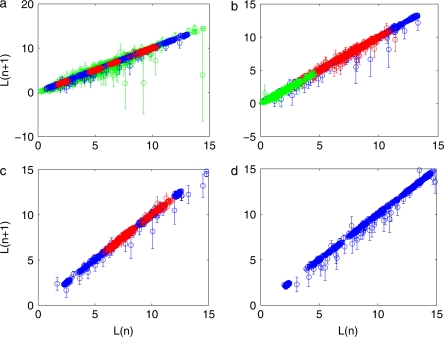
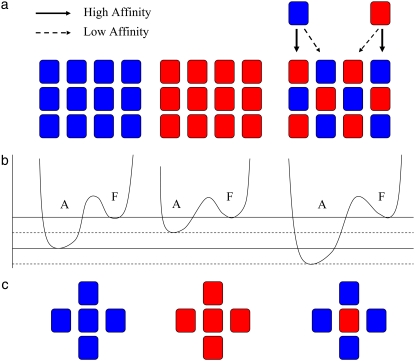
Numerous isotypes of the structural protein tubulin have now been characterized in various organisms and their expression offers a plausible explanation for observed differences affecting microtubule function in vivo. While this is an attractive hypothesis, there are only a handful of studies demonstrating a direct influence of tubulin isotype composition on the dynamic properties of microtubules. Here, we present the results of experimental assays on the assembly of microtubules from bovine brain tubulin using purified isotypes at various controlled relative concentrations. A novel data analysis is developed using recursive maps which are shown to be related to the master equation formalism. We have found striking similarities between the three isotypes of bovine tubulin studied in regard to their dynamic instability properties, except for subtle differences in their catastrophe frequencies. When mixtures of tubulin isotypes are analyzed, their nonlinear concentration dependence is modeled and interpreted in terms of lower affinities of tubulin dimers belonging to the same isotype than those that represent different isotypes indicating hitherto unsuspected influences of tubulin dimers on each other within a microtubule. Finally, we investigate the fluctuations in microtubule assembly and disassembly rates and conclude that the inherent rate variability may signify differences in the guanosine-5'-triphosphate composition of the growing and shortening microtubule tips. It is the main objective of this article to develop a quantitative model of tubulin polymerization for individual isotypes and their mixtures. The possible biological significance of the observed differences is addressed.


Figures

FIGURE 1
FIGURE 1
Raw data for the selected (a) αβII and (b) αβIII tubulin isotype measurements performed by O. Azarenko, L. Wilson, and M. A. Jordan (unpublished).
FIGURE 2
FIGURE 2
Normalized frequency distribution histograms of growing and shortening rates of microtubules made up of (a) αβII, (b) αβIII, (c) αβIV tubulin dimers, and (d) unfractionated IUT. Red bars represent the data reported in Panda et al. (14), blue bars represent the data from Derry et al. (15), and green bars refer to the data collected by O. Azarenko, L. Wilson, and M. A. Jordan (unpublished).
FIGURE 3
FIGURE 3
The probability distribution function for growth (left panels) and shortening (right panels) of MTs made up of purified αβII (a and b), αβIII (c and d), αβIV (e and f) tubulin, and unfractionated IUT (g and h). Pink bars correspond to the data from Panda et al. (14) and blue bars are based on the observations in Derry et al. (15). An exponential fit, a exp(−λℓ), is also shown where coefficients a and λ are given in Table 5.
FIGURE 4
FIGURE 4
Recursive plots for purified (a) αβII, (b) αβIII, (c) αβIV tubulin, and (d) IUT based on the data reported by Panda et al. (14) (shown with red circles), Derry et al. (15) (shown with blue circles), and the data by O. Azarenko, L. Wilson, and M. A. Jordan (unpublished; shown with green circles). The slopes and intercepts for different data sets are given in Table 4.
FIGURE 5
FIGURE 5
Overall percentage of time spent by a microtubule in the growing, shortening, or attenuation states. The bars are calculated by averaging over all the data.
FIGURE 6
FIGURE 6
Schematic representation of MTs made up of the purified αβII (blue squares) and αβIII (red squares) tubulin and mixtures of αβII and αβIII. (a) It is assumed that the affinity between an αβII and an αβIII dimer is greater than that between either two αβII dimers or two αβIII dimers. As a result, an MT made up of mixed isotypes has a more stable assembled structure than that of isotypically purified MTs. This is shown in panel b where the potential barrier between the assembled state (A) and the free tubulin state (F) is deeper for the mixed structure. The αβIII MT has a smaller potential barrier based on the observations made by Panda et al. (14). (c) The simplest possible sublattice for purified and mixed MTs.
FIGURE 7
FIGURE 7
Concentration dependence of dynamicity (white bars) and the percentage of total time that MTs spent in the attenuated state (gray bars) for a mixed αβII/αβIII solution. Bars are calculated based on the clustering model. The squares and diamonds represent the experimental values reported by Panda et al. (14).
FIGURE 8
FIGURE 8
Schematic representation of the potential barrier between an assembled MT and free tubulin at the plus-end (upper panel) and minus-end (lower panel). The values kon and koff represent association and dissociation rates related to the free energies ΔEon and ΔEoff. The possible fluctuations in the free energies, δEon and δEoff, increase or decrease the association and dissociation rates, respectively, as per the Arrhenius relationship.
FIGURE 9
FIGURE 9
Panel a shows a fragment of the αβIII while panel b shows the αβIV microtubule. Red stick residues are the differences within the isotypes that occur on the tubulin surface. The adjacent monomers are colored pink for α-values and blue for β-values. The α-values that make up the intradimer interface are at the bottom of the image and the α-values that make up the interdimer interface are at the top. The yellow surfaces are those residues that interact with isotype differences within a six-angstrom cutoff. These residues are labeled in blue text. The residues within the β-isotypes that interact with adjacent monomers are labeled in yellow text, with the appropriate αβII to αβIII to αβIV substitutions indicated. Within the αβIII isotype, the residues that interact with the α-values at the bottom might interfere with dimer assembly itself.

References

    1. Dustin, P. 1984. Microtubules, 2nd Ed. Springer, Berlin.
    1. Alberts, B., J. Lewis, M. Raff, K. Roberts, and J. D. Watson. 1994. Molecular Biology of the Cell. Garland, New York.
    1. Mitchison, T., and M. Krischner. 1984. Microtubule assembly nucleated by isolated centrosomes. Nature. 312:232–236. - PubMed
    1. Rezania, V., and J. A. Tuszynski. 2007. From a quantum mechanical description of the assembly processes in microtubules to their semiclassical nonlinear dynamics. Quantum Biosys. 1:1–20.
    1. Erickson, H. P., and T. E. O'Brien. 1992. Microtubule dynamic instability and GTP hydrolysis. Annu. Rev. Biophys. Biomol. Struct. 21:145–166. - PubMed

Publication types

LinkOut - more resources