. 2008 Sep 15;95(6):3009-16.
doi: 10.1529/biophysj.107.128173. Epub 2008 May 23.

Localized acetylcholine receptor clustering dynamics in response to microfluidic focal stimulation with agrin

Affiliations

Localized acetylcholine receptor clustering dynamics in response to microfluidic focal stimulation with agrin

Anna Tourovskaia et al. Biophys J. .

Abstract

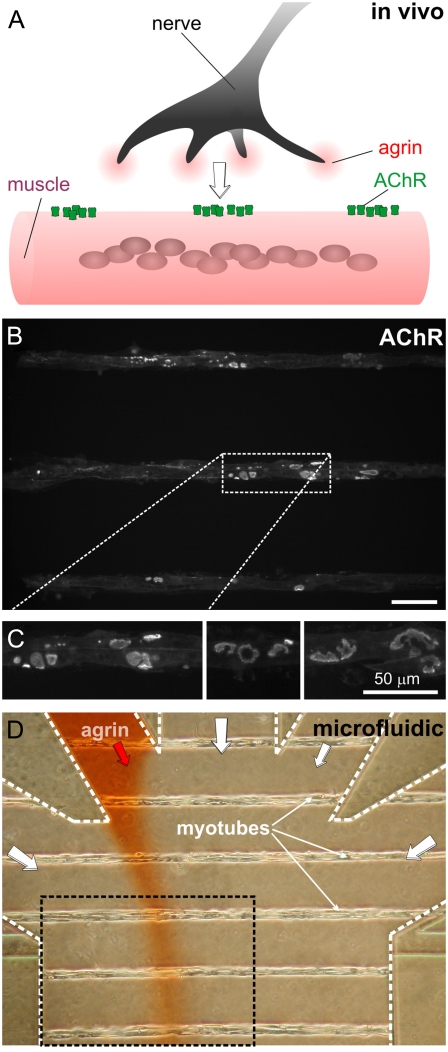
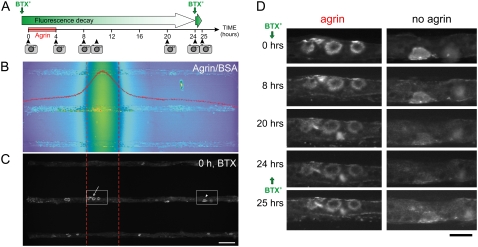
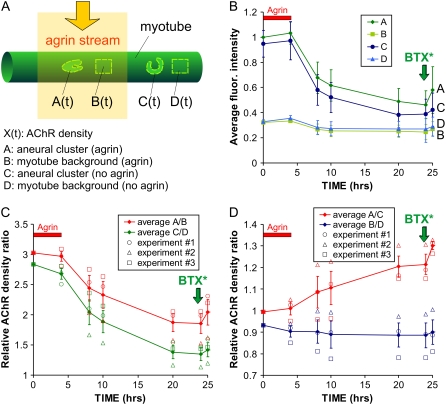
Agrin is a proteoglycan secreted by the motor neuron's growing axon terminal upon contact with the muscle during embryonic development. It was long thought that agrin's role was to trigger the clustering of acetylcholine receptors (AChRs) to nascent synapse sites. However, agrin-predating, protosynaptic AChR clusters are present well before innervation in the embryo and in myotube cultures, yet no role has been conclusively ascribed to agrin. We used a microfluidic device to focally deliver agrin to protosynaptic AChR clusters in micropatterned myotube cultures. The distribution of AChRs labeled with fluorescent bungarotoxin was imaged at various time points over >24 h. We find that a 4-h focal application of agrin (100 nM) preferentially reduces AChR loss at agrin-exposed clusters by 17% relative to the agrin-deprived clusters on the same myotube. In addition, the focal application increases the addition of AChRs preferentially at the clusters by 10% relative to the agrin-exposed, noncluster areas. Taken together, these findings suggest that a focal agrin stimulus can play a key stabilizing role in the aggregation of AChRs at the early stages of synapse formation. This methodology is generally applicable to various developmental processes and cell types, including neurons and stem cells.


Figures

FIGURE 1
FIGURE 1
Synaptogenesis on a chip. (A) During development, neurons release agrin at the site of contact between nerve and muscle. (B) Fluorescence micrograph of a portion of the myotube microarray after staining the AChRs with Alexa Fluor 488-conjugated α-bungarotoxin (BTX*). Scale bar is 50 μm. (C) Three high-magnification fluorescence micrographs of myotubes stained with BTX*, showing that aneural AChR clusters display intricate shapes similar to those found in vivo. (D) Phase-contrast micrograph of the microfluidic device containing a ladder micropattern of myotubes during stimulation by a laminar stream of agrin (spiked with red Allura dye for visualization). The black-dashed box corresponds to the area shown in panel B.
FIGURE 2
FIGURE 2
Focal application of agrin onto aneural AChR clusters. (A) Schematic of the experimental design showing the application of fluorescent AChR label (BTX*, green vertical arrows) and of agrin with the imaging times (camera icons). (B) Fluorescence micrograph (false color) of the stream of a fluorescent agrin tracer (Texas Red-conjugated BSA) taken at the end of the experiment, which serves to extrapolate the agrin concentration profile (see Data S1). Overlaid is a line scan (red curve) across the micrograph; clusters are considered exposed to agrin if they are in an area exposed to at least 10% of the maximal agrin concentration, and agrin-deprived otherwise. For reference, red dashed lines denote 50% of maximal agrin concentration. (C) Fluorescence BTX* staining of the same area as in panel B, showing three myotubes across the device. Scale bar is 50 μm. (D) Time evolution of the two areas boxed in panel C from the same myotube. The myotubes were labeled with BTX* right before t = 0 h and right after the t = 24 h time-point image. Cells were focally exposed to agrin (0–4 h) and imaged at the indicated time points. Scale bar is 25 μm.
FIGURE 3
FIGURE 3
Local AChR density dynamics. (A) Schematic representation of the four regions that are defined and marked for analysis: cluster(s) and myotube background exposed to agrin (regions A and B, respectively) and cluster(s) and myotube background not exposed to agrin (C and D, respectively); A and C are typically comprised of several (range 2–16, average 8 ± SD 5.5) individual clusters. After labeling with a saturating dose of BTX* and background correction, fluorescence intensity in a region X (X = A, B, C, or D) is assumed to be proportional to AChR density, termed X(t). (B) Graph of the average fluorescence intensities in regions AC and (values relative to the average A(0) for all myotubes) in a representative experiment containing N = 23 myotubes. BTX* was reapplied after t = 24 h (green vertical arrows) to visualize the total AChR density and to assess AChR addition (the t = 24 h data point for experiment 3 could not be obtained, so it was conservatively taken to be equal to the t = 20 h data point, despite the additional 4 h of degradation; this results in a lower estimate of AChR addition upon relabeling). (C) AChR density ratios (as indicated) as a function of time for n = 3 experiments (total N = 48 myotubes).

References

    1. Cohen-Cory, S. 2002. The developing synapse: construction and modulation of synaptic structures and circuits. Science. 298:770–776. - PubMed
    1. Kandel, E. R., J. H. Schwartz, and T. M. Jessel. 2000. The formation and regeneration of synapses. In Principles of Neural Science. E. R. Kandel, J. H. Schwartz, and T. M. Jessel, editors. McGraw-Hill, New York.
    1. Dai, Z., and H. B. Peng. 2001. Fluorescent imaging of nicotinic receptors during neuromuscular junction development. In Ion Channel Localization: Methods and Protocols. A. N. Lopatin and C. G. Nichols, editors. Humana Press, Totowa, NJ.
    1. Anderson, M. J., and M. W. Cohen. 1977. Nerve-induced and spontaneous redistribution of acetylcholine receptors on cultured muscle cells. J. Physiol. 268:757–773. - PMC - PubMed
    1. Lin, S., L. Landmann, M. A. Ruegg, and H. R. Brenner. 2008. The role of nerve- versus muscle-derived factors in mammalian neuromuscular junction formation. J. Neurosci. 28:3333–3340. - PMC - PubMed

Publication types

LinkOut - more resources