Comparative Study
. 2008 Jul;36(12):e69.
doi: 10.1093/nar/gkn331. Epub 2008 May 24.

Efficient cytosolic delivery of molecular beacon conjugates and flow cytometric analysis of target RNA

Affiliations
Comparative Study

Efficient cytosolic delivery of molecular beacon conjugates and flow cytometric analysis of target RNA

Antony K Chen et al. Nucleic Acids Res. 2008 Jul.

Abstract

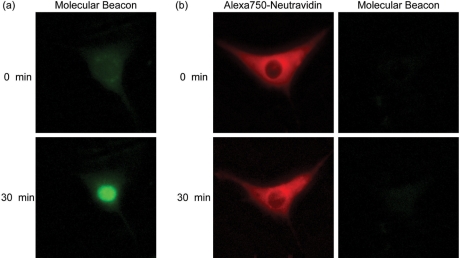
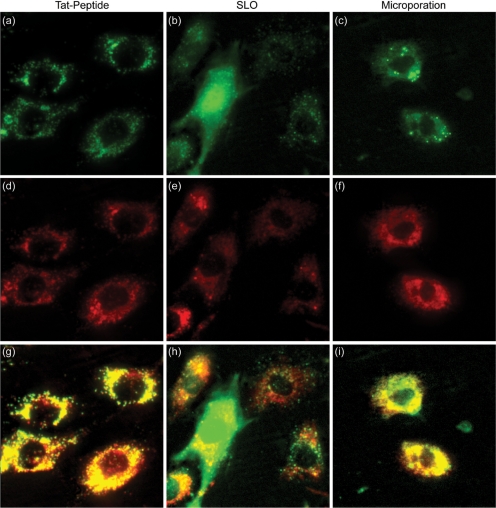
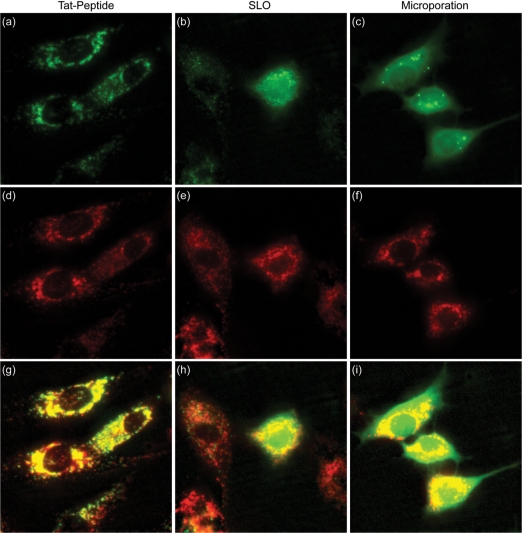
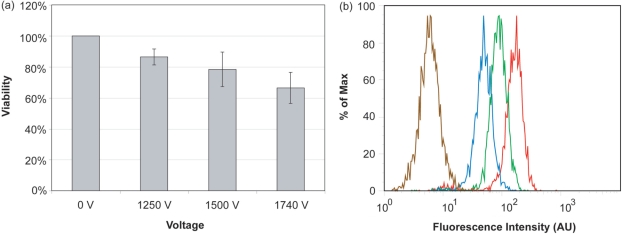
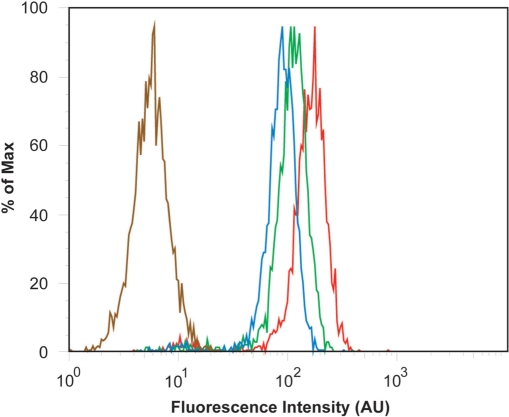
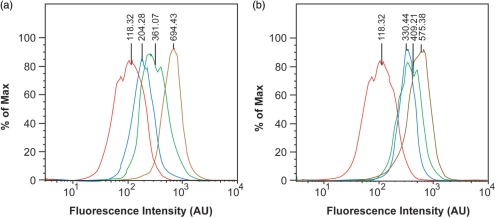
Fluorescent microscopy experiments show that when 2'-O-methyl-modified molecular beacons (MBs) are introduced into NIH/3T3 cells, they elicit a nonspecific signal in the nucleus. This false-positive signal can be avoided by conjugating MBs to macromolecules (e.g. NeutrAvidin) that prevent nuclear sequestration, but the presence of a macromolecule makes efficient cytosolic delivery of these probes challenging. In this study, we explored various methods including TAT peptide, Streptolysin O and microporation for delivering NeutrAvidin-conjugates into the cytosol of living cells. Surprisingly, all of these strategies led to entrapment of the conjugates within lysosomes within 24 h. When the conjugates were pegylated, to help prevent intracellular recognition, only microporation led to a uniform cytosolic distribution. Microporation also yielded a transfection efficiency of 93% and an average viability of 86%. When cells microporated with MB-NeutrAvidin conjugates were examined via flow cytometry, the signal-to-background was found to be more than 3 times higher and the sensitivity nearly five times higher than unconjugated MBs. Overall, the present study introduces an improved methodology for the high-throughput detection of RNA at the single cell level.


Figures

Figure 1.
Figure 1.
Intracellular fluorescence of MBs and NeutrAvidin–MB conjugates. (a) Fluorescent microscopy images of NIH/3T3 cells injected with 2′-O-methyl RNA MBs. The MBs were not perfectly complementary to any known endogenous RNA in mice. (b) NIH/3T3 cells were injected with MB–NeutrAvidin conjugates. NeutrAvidin was labeled with the fluorescent dye, Alexa750, to facilitate imaging of their intracellular distribution.
Figure 2.
Figure 2.
Delivery of NeutrAvidin conjugates into single living cells. Cy5-labeled NeutrAvidins were delivered into NIH/3T3 cells either by (a) TAT-peptide, (b) SLO or (c) microporation. Images corresponding to TAT-peptide-based delivery and microporation were acquired 24 h following delivery. Images corresponding to delivery via SLO were acquired immediately after the permeabilized membranes were resealed, ∼1.5 h. Subsequent staining of the cells with LysoTracker was used to determine whether the pegylated NeutrAvidin was localized within lysosomes for each of the delivery methods, (d) TAT-peptide, (e) SLO and (f) microporation. The merged NeutrAvidin and lysosome images for (g) TAT peptide, (h) SLO, and (i) microporation show all colocalized fluorescent signals as yellow in color. The contrast in the yellow channel of the merged images was increased to more clearly distinguish areas of colocalization from the pure red and green signals.
Figure 3.
Figure 3.
Delivery of pegylated NeutrAvidin into single living cells. Cy5-labeled NeutrAvidins colabeled with PEG were delivered into NIH/3T3 cells either by (a) TAT peptide, (b) SLO or (c) microporation. Images corresponding to TAT-peptide-based delivery and microporation were acquired 24 h following delivery. Images corresponding to delivery via SLO were acquired immediately after the permeabilized membranes were resealed, ∼1.5 h. Subsequent staining of the cells with LysoTracker was used to determine whether the pegylated NeutrAvidin was localized within lysosomes for each of the delivery methods, (d) TAT-peptide, (e) SLO, and (f) microporation. The merged NeutrAvidin and lysosme images for (g) TAT peptide, (h) SLO and (i) microporation show all colocalized fluorescent signals as yellow in color. The contrast in the yellow channel of the merged images was increased to more clearly distinguish areas of colocalization from the pure red and green signals.
Figure 4.
Figure 4.
The effect of microporation voltage settings on cell viability and transfection efficiency. (a) NIH/3T3 cells were microporated in the presence of 3 μM FITC-labeled, pegylated NeutrAvidins at 0, 1250, 1500 or 1740 V. The corresponding viability was determined by MTT assay. Viability was determined relative to cells that were not microporated (0 V). (b) Flow cytometry histograms for NIH/3T3 cells microporated at different voltage levels 0 V (brown), 1250 V (blue), 1500 V (green) and 1740 V (red).
Figure 5.
Figure 5.
The effect of probe concentration on transfection efficiency. NIH/3T3 cells were microporated in the presence of 0 μM (brown), 1 μM (blue), 2 μM (green) and 3 μM (red) of FITC-labeled and pegylated NeutrAvidin at 1740 V before being analyzed by flow cytometry.
Figure 6.
Figure 6.
Flow cytometric measurements of MB fluorescence in NIH/3T3 cells. NIH/3T3 cells were microporated in the presence of (a) MB–NeutrAvidin conjugates or (b) unconjugated MBs. The flow cytometry histograms correspond to cells that do not contain luciferase RNA targets and were microporated in the absence of probe (negative control, red); cells that do not contain luciferase RNA targets and were microporated in the presence of probes (negative control, blue); cells that express luciferase RNA targets and were microporated in the presence of probes (green); and cells that express luciferase and were microporated in the presence of pre-hybridized probes (positive control, brown).

References

    1. Tyagi S, Kramer FR. Molecular beacons: probes that fluoresce upon hybridization. Nat. Biotechnol. 1996;14:303–308. - PubMed
    1. Tyagi S, Alsmadi O. Imaging native beta-actin mRNA in motile fibroblasts. Biophys. J. 2004;87:4153–4162. - PMC - PubMed
    1. Bratu DP, Cha BJ, Mhlanga MM, Kramer FR, Tyagi S. Visualizing the distribution and transport of mRNAs in living cells. Proc. Natl Acad. Sci. USA. 2003;100:13308–13313. - PMC - PubMed
    1. Santangelo P, Nix B, Tsourkas A, Bao G. Dual FRET molecular beacons for mRNA detection in living cells. Nucleic Acids Res. 2004;32:e57. - PMC - PubMed
    1. Chen AK, Behlke MA, Tsourkas A. Avoiding false-positive signals with nuclease-vulnerable molecular beacons in single living cells. Nucleic Acids Res. 2007;35:e105. - PMC - PubMed

Publication types

MeSH terms