. 2008 Jun 2;181(5):727-35.
doi: 10.1083/jcb.200801083. Epub 2008 May 26.

Distinct versus overlapping functions of MDC1 and 53BP1 in DNA damage response and tumorigenesis

Affiliations

Distinct versus overlapping functions of MDC1 and 53BP1 in DNA damage response and tumorigenesis

Katherine Minter-Dykhouse et al. J Cell Biol. .

Abstract

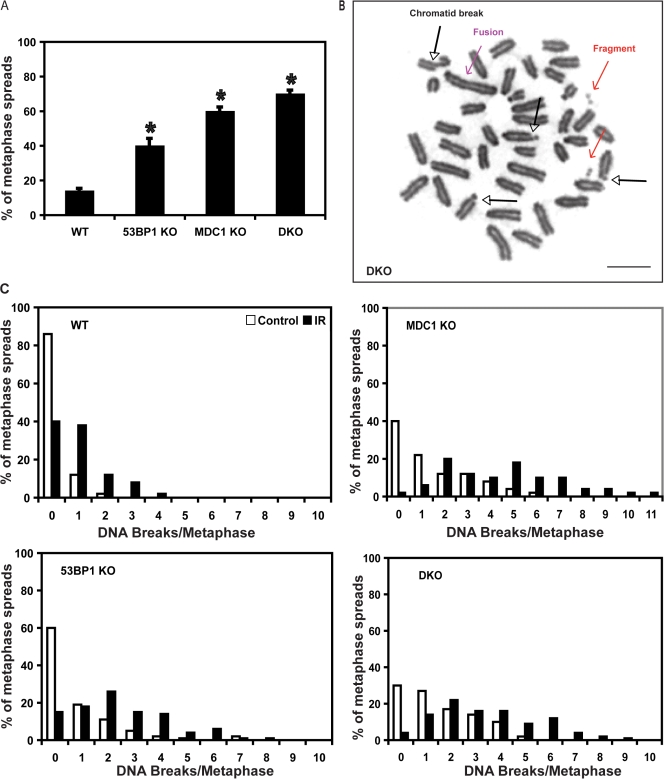
The importance of the DNA damage response (DDR) pathway in development, genomic stability, and tumor suppression is well recognized. Although 53BP1 and MDC1 have been recently identified as critical upstream mediators in the cellular response to DNA double-strand breaks, their relative hierarchy in the ataxia telangiectasia mutated (ATM) signaling cascade remains controversial. To investigate the divergent and potentially overlapping functions of MDC1 and 53BP1 in the ATM response pathway, we generated mice deficient for both genes. Unexpectedly, the loss of both MDC1 and 53BP1 neither significantly increases the severity of defects in DDR nor increases tumor incidence compared with the loss of MDC1 alone. We additionally show that MDC1 regulates 53BP1 foci formation and phosphorylation in response to DNA damage. These results suggest that MDC1 functions as an upstream regulator of 53BP1 in the DDR pathway and in tumor suppression.


Figures

Figure 1.
Figure 1.
Radiosensitivity of DKO mice and MEFs. (A) Kaplan-Meier survival curve of WT (n = 9), 53BP1−/− (n = 8), MDC1−/− (n = 10), and DKO (n = 8) mice after 7 Gy of whole body IR. (B) Survival of WT, 53BP1−/−, MDC1−/−, and DKO MEFs 5 d after 0, 1, and 2 Gy IR as determined by Trypan blue exclusion. Error bars represent SEM from two independent experiments. (C) Survival of WT, 53BP1−/−, MDC1−/−, and DKO MEFs 48 h after continuous treatment with the indicated amounts of MMC. Error bars represent SEM from four independent experiments.
Figure 2.
Figure 2.
Genomic instability in 53BP1−/−, MDC1−/−, and DKO MEFs. Mitotic spreads were produced as described in Materials and methods. (A) The percentage of mitotic spreads with spontaneous chromosomal abnormalities was determined by light microscopy. The asterisk denotes a significant difference from WT (53BP1−/− compared with WT, P = 0.00019; MDC1−/− compared with WT, P = 3.35 × 10⁻⁶; DKO compared with WT, P = 1.01 × 10⁻¹¹). (B) Representative pictures of chromosomal aberrations from DKO MEFs. Different aberrations are indicated by colored arrows. (C) Percentage of metaphase spreads with the indicated number of DNA breaks from unirradiated or irradiated MEFs. 100 metaphase spreads/genotype were evaluated. Bar, 10 μM.
Figure 3.
Figure 3.
T cell development, tumor incidence, and spectrum in WT, MDC1−/−, and DKO mice. (A) Lymphocytes from WT, MDC1−/−, 53BP1−/−, and DKO mice. Numbers in each quadrant indicate percentage of the total population. (B and C) Spontaneous tumor incidence and spectrum in WT (n = 19), MDC1−/− (n = 20), and DKO (n = 27) mice for up to 21 mo were determined. The asterisk denotes significant difference from WT (tumor incidence in MDC1−/− mice compared with WT mice, P = 7.6 × 10⁻⁶; incidence in DKO mice compared with WT, P = 1.26 × 10⁻⁹). (D) Representative pictures of lymphoma and lung cancer from MDC1−/− and DKO mice.
Figure 4.
Figure 4.
DKO MEFs do not have more severe defects in ATM activation and G2/M checkpoint activation. (A and B) ATM, Chk1, and Chk2 activation in wild-type (WT), MDC1−/−, and double knockout (DKO or MDC1/53BP1−/−) MEFs. MEFs of the indicated genotypes were irradiated at the indicated doses and harvested 1 h later (A) or irradiated (2 Gy) and harvested at different time points (B). Cell extracts were then blotted with the indicated antibodies. (C) MEFs were left untreated or irradiated (2 Gy). 1 h later, cells were stained for antiphospho-H3 antibodies, and mitotic populations were determined by FACS. Error bars represent SEM.
Figure 5.
Figure 5.
MDC1 regulates 53BP1 foci formation and phosphorylation. (A–C) MEFs of the indicated genotypes were irradiated (10 Gy), and foci formation of MDC1, 53BP1, RNF8, and γH2AX was determined by immunofluorescence. (D) MDC1+/+ and MDC1−/− MEF cells were irradiated (2 Gy), and, 1 h later, 53BP1 was immunoprecipitated and blotted with the indicated antibodies. (E) Proposed model of the regulation of 53BP1 phosphorylation and localization by MDC1. Bars, 10 μM.

References

    1. Abraham, R.T. 2001. Cell cycle checkpoint signaling through the ATM and ATR kinases. Genes Dev. 15:2177–2196. - PubMed
    1. Anderson, L., C. Henderson, and Y. Adachi. 2001. Phosphorylation and rapid relocalization of 53BP1 to nuclear foci upon DNA damage. Mol. Cell. Biol. 21:1719–1729. - PMC - PubMed
    1. Bartkova, J., I.Z. Horej Sbreve, M. Sehested, J.M. Nesland, E. Rajpert-De Meyts, N.E. Skakkebaek, M. Stucki, S. Jackson, J. Lukas, and J. Bartek. 2007. DNA damage response mediators MDC1 and 53BP1: constitutive activation and aberrant loss in breast and lung cancer, but not in testicular germ cell tumours. Oncogene. 26:7414–7422. - PubMed
    1. Bekker-Jensen, S., C. Lukas, F. Melander, J. Bartek, and J. Lukas. 2005. Dynamic assembly and sustained retention of 53BP1 at the sites of DNA damage are controlled by Mdc1/NFBD1. J. Cell Biol. 170:201–211. - PMC - PubMed
    1. Brugmans, L., R. Kanaar, and J. Essers. 2007. Analysis of DNA double-strand break repair pathways in mice. Mutat. Res. 614:95–108. - PubMed

Publication types

MeSH terms

Substances