. 2008 Jun 9;205(6):1381-93.
doi: 10.1084/jem.20080034. Epub 2008 May 26.

In vivo equilibrium of proinflammatory IL-17+ and regulatory IL-10+ Foxp3+ RORgamma t+ T cells

Affiliations

In vivo equilibrium of proinflammatory IL-17+ and regulatory IL-10+ Foxp3+ RORgamma t+ T cells

Matthias Lochner et al. J Exp Med. .

Abstract

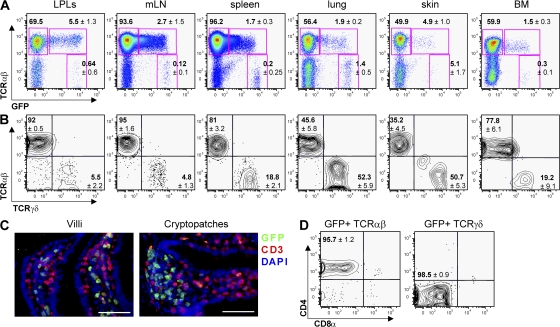
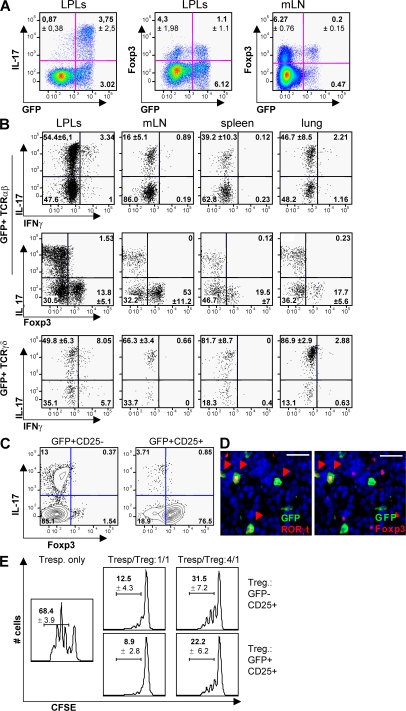
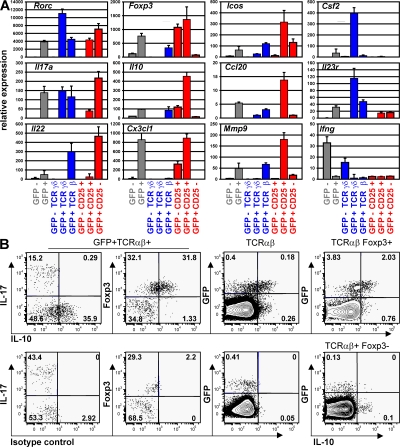
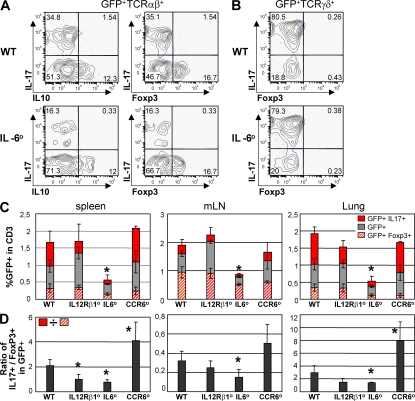
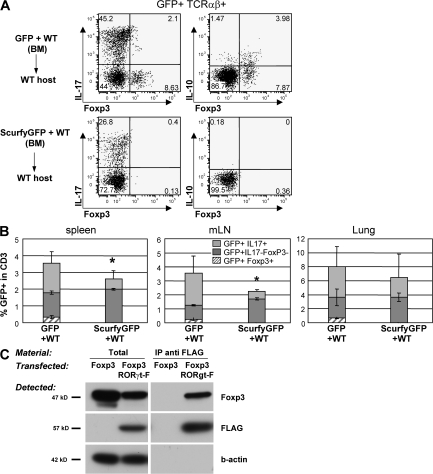
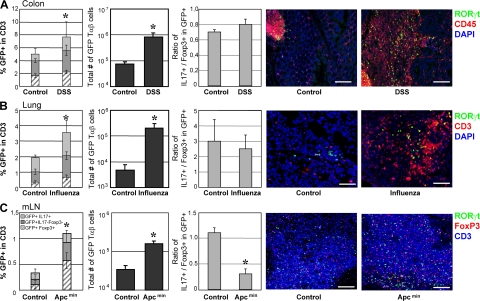
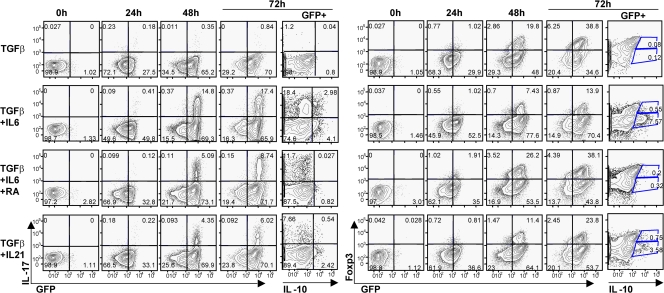
The nuclear hormone receptor retinoic acid receptor-related orphan receptor gamma t (RORgamma t) is required for the generation of T helper 17 cells expressing the proinflammatory cytokine interleukin (IL)-17. In vivo, however, less than half of RORgamma t(+) T cells express IL-17. We report here that RORgamma t(+) T alphabeta cells include Foxp3(+) cells that coexist with IL-17-producing RORgamma t(+) T alphabeta cells in all tissues examined. The Foxp3(+) RORgamma t(+) T alphabeta express IL-10 and CCL20, and function as regulatory T cells. Furthermore, the ratio of Foxp3(+) to IL-17-producing RORgamma t(+) T alphabeta cells remains remarkably constant in mice enduring infection and inflammation. This equilibrium is tuned in favor of IL-10 production by Foxp3 and CCL20, and in favor of IL-17 production by IL-6 and IL-23. In the lung and skin, the largest population of RORgamma t(+) T cells express the gammadelta T cell receptor and produce the highest levels of IL-17 independently of IL-6. Thus, potentially antagonistic proinflammatory IL-17-producing and regulatory Foxp3(+) RORgamma t(+) T cells coexist and are tightly controlled, suggesting that a perturbed equilibrium in RORgamma t(+) T cells might lead to decreased immunoreactivity or, in contrast, to pathological inflammation.


Figures

Figure 1.
Figure 1.
Diversity and distribution of RORγt+ T cells in vivo. (A and B) Flow cytometry analysis of cells isolated from the organs of 8–12-wk-old Rorc(γt)-GfpTG mice. Plots are gated on CD3+ cells (A) or GFP+ CD3+ cells (B). Numbers indicate mean percent cells in quadrants ± SD obtained with at least three Rorc(γt)-GfpTG mice. LPLs, lamina propria lymphocytes isolated from small intestine; mLN, mesenteric LNs; BM, bone marrow. (C) Immunofluorescence histology of RORγt+ cells in the small intestine of Rorc(γt)-GfpTG mice. Most RORγt+ cells in villi are T cells, whereas RORγt+ cells in cryptopatches located between crypts are CD3 LTi cells. Bar, 50 μm. (D) Expression of CD4 and CD8α by spleen GFP+TCR-β+ and lung or GFP+TCR-δ+ cells.
Figure 2.
Figure 2.
RORγt+ T cells include Th17 and Foxp3+ T reg cells. (A and B) Flow cytometry analysis of cells isolated from Rorc(γt)-GfpTG mice. Cells were restimulated in vitro with PMA/ionomycin for 5 h and subjected to intracellular staining for GFP, IL-17, Foxp3, and/or IFN-γ. Plots are gated on TCR-β+ cells (A) and GFP+TCR-β+ or GFP+TCR-δ+ cells (B). Numbers indicate mean percent cells in quadrants ± SD obtained with at least three Rorc(γt)-GfpTG mice. (C) CD4+ T cells isolated from the spleen and mesenteric LNs of Rorc(γt)-GfpTG mice were sorted into two populations based on their expression of GFP and CD25. Sorted cells were subsequently restimulated in vitro and stained for IL-17 and Foxp3. Results are representative of three independent experiments. (D) Immunofluorescence histology staining for GFP, RORγt, Foxp3, and nuclei (DAPI) of a mesenteric LN isolated from a Rorc(γt)-GfpTG mouse. Arrowheads indicate cells expressing RORγt and/or Foxp3. Bar, 20 μm. (E) Proliferation assay of CD4+ T cells isolated from the spleen and mesenteric LNs of Rorc(γt)-GfpTG mice and sorted into two populations based on their expression of GFP and CD25. CFSE-labeled CD25 responder T cells (2.5 × 10⁴) were cultured alone (left) or together with either GFPCD25+ T cells or GFP+CD25+ T cells (2.5 × 10⁴ or 0.625 × 10⁴ cells). Cells were cultured in duplicates for 3 d in the presence of 105 irradiated spleen cells and anti-CD3ε antibody. Numbers indicate frequency of proliferating cells (± SD) obtained from three independent experiments.
Figure 3.
Figure 3.
RORγt+ T cells express genes involved in the Th17 or T reg cell pathway. (A) Cells isolated from the spleen and mesenteric LNs of Rorc(γt)-GfpTG mice were sorted into eight distinct populations based on their expression of GFP, CD3, TCR-β, TCR-δ, CD4, and CD25 (Fig. S1), and gene expression was assessed using real-time PCR. Ct values were normalized to the mean Ct of five housekeeping genes. Data are the mean of two or three independent experiments. (B) Foxp3+ RORγt+ T cells express IL-10. Cells isolated from LNs of Rorc(γt)-GfpTG mice were restimulated in vitro with PMA/ionomycin for 5 h and subjected to intracellular staining for GFP, IL-17, Foxp3, and IL-10 or an isotype control. Numbers indicate percent cells in quadrants. Results are representative of at least three individual experiments.
Figure 4.
Figure 4.
The role of IL-6, IL-12Rβ1, and CCR6 in the generation of RORγt+ T cell subsets. (A and B) Cells were isolated from the spleen of Rorc(γt)-GfpTG (WT) or Il6−/−× Rorc(γt)-GfpTG (IL-6°) mice, restimulated in vitro with PMA/ionomycin for 5 h and subjected to intracellular staining for GFP, IL-17, Foxp3, and IL-10. Plots are gated on GFP+TCR-β+ cells (A) or GFP+TCR-δ+ cells (B). Numbers indicate percent cells in quadrants and are representative of two independent experiments. (C) Cells were isolated from the spleen, mesenteric LN, and lung of Rorc(γt)-GfpTG (WT), Il12rb1−/−× Rorc(γt)-GfpTG (IL12Rβ1°), Ccr6−/− × Rorc(γt)-GfpTG (CCR6°), or Il6−/−× Rorc(γt)-GfpTG mice (IL-6°) and processed as in A and B. Histograms report percent GFP+TCR-β+ cell subsets in total T cells. Each bar also shows the percentages of IL-17+ and Foxp3+ cells within the GFP+TCR-β+ cell population. (D) Histograms report the ratio of the frequencies of IL-17–producing GFP+TCR-β+ cells to Foxp3+ GFP+TCR-β+ cells as indicated in the figure. Three to five mice were analyzed per group. *, P < 0.05 as compared with WT.
Figure 5.
Figure 5.
Regulation of RORγt+ T cells by Foxp3. (A and B) Bone marrow cells isolated from CD45.2+Rorc(γt)-GfpTG (WT) or Foxp3sf × Rorc(γt)-GfpTG (Scurfy) mice were mixed with bone marrow cells isolated from CD45.1+ C57BL/6 mice and injected into irradiated lymphopenic mice. 6 wk after transfer, cells were isolated from the spleen, LN, and lung and restimulated in vitro with PMA/ionomycin for 5 h and subjected to intracellular staining for GFP, IL-17, Foxp3, and IL-10. (A) Spleen cells are gated on GFP+TCR-β+ cells. Numbers indicate percent cells in quadrants. Reconstitutions with CD45.1+ and CD45.2+ cells were comparable in all chimeras. Results are representative of two independent experiments. (B) Histograms report percent GFP+TCR-β+ cell subsets in total CD45.2+ T cells (see Fig. 4 C). *, P < 0.05 as compared with WT. (C) Immunoprecipitation of RORγt and Foxp3. Foxp3 was expressed in HEK293T cells alone or together with N-terminally FLAG-tagged RORγt. Total cell lysates or immunoprecipitates (IP) using anti-FLAG antibody were blotted and probed with antibodies to Foxp3, FLAG, or β-actin. Results are representative of two independent experiments.
Figure 6.
Figure 6.
Equilibrium in RORγt+ T cell subsets during pathology. (A) Rorc(γt)-GfpTG mice were treated with DSS in the drinking water for 6 d, followed by water for 10 d. This protocol was repeated for a total of three cycles. After the last cycle, cells isolated from the colon were restimulated in vitro with PMA/ionomycin for 5 h and subjected to intracellular staining for GFP, IL-17, and Foxp3. Histograms (from left to right) report percent GFP+TCR-β+ cell subsets in total T cells (see Fig. 4 C), total numbers of RORγt+ Tαβ cells present in the organ, and the ratio of IL-17–producing to Foxp3+ cells within RORγt+ Tαβ cells (see Fig. 4 D). Right panels show immunofluorescence histology of a colon from a healthy or a treated Rorc(γt)-GfpTG mouse. Bar, 100 μm. (B) Rorc(γt)-GfpTG mice were infected intranasally with 100 PFUs of influenza A virus for 7 d. Cells were then isolated from the lung and processed as in A. Right panels show immunofluorescence histology of a lung from healthy or an infected Rorc(γt)-GfpTG mouse. Bar, 50 μm. (C) Cells were isolated from the mesenteric LNs of a 4-mo-old Rorc(γt)-GfpTG × Apcmin/+ mouse and processed as in A. Right panels show immunofluorescence histology of a mesenteric LN from a normal or a tumor-bearing mouse. Bar, 100 μm. Data shown are representative of at least three independent experiments. Three to four mice were analyzed per group. *, P < 0.05 as compared with control (mock-treated or WT mice).
Figure 7.
Figure 7.
Generation and differentiation of RORγt+ Tαβ cells in vitro. MACS-sorted naive (CD62L+) CD4+ T cells from the spleens of Rorc(γt)-GfpTG mice were stimulated in duplicates with anti-CD3ε and anti-CD28 in the presence of blocking anti–IFN-γ and anti–IL-4 antibodies and the indicated cytokines or RA. After different periods of time, cells were restimulated with PMA/ionomycin for 5 h and analyzed by flow cytometry for the expression of GFP, Foxp3, IL-17, and IL-10. All plots are gated on TCR-β+ cells, except plots for IL-10 that are gated on GFP+TCR-β+ cells. Numbers indicate percent cells in quadrants. Data are representative of three independent experiments.

References

    1. Mosmann, T.R., and R.L. Coffman. 1989. Th1 and Th2 cells: different patterns of lymphokine secretion lead to different functional properties. Annu. Rev. Immunol. 7:145–173. - PubMed
    1. Weaver, C.T., R.D. Hatton, P.R. Mangan, and L.E. Harrington. 2007. IL-17 family cytokines and the expanding diversity of effector T cell lineages. Annu. Rev. Immunol. 25:821–852. - PubMed
    1. Kastelein, R.A., C.A. Hunter, and D.J. Cua. 2007. Discovery and biology of IL-23 and IL-27: related but functionally distinct regulators of inflammation. Annu. Rev. Immunol. 25:221–242. - PubMed
    1. Nurieva, R., X.O. Yang, G. Martinez, Y. Zhang, A.D. Panopoulos, L. Ma, K. Schluns, Q. Tian, S.S. Watowich, A.M. Jetten, and C. Dong. 2007. Essential autocrine regulation by IL-21 in the generation of inflammatory T cells. Nature. 448:480–483. - PubMed
    1. Korn, T., E. Bettelli, W. Gao, A. Awasthi, A. Jager, T.B. Strom, M. Oukka, and V.K. Kuchroo. 2007. IL-21 initiates an alternative pathway to induce proinflammatory T(H)17 cells. Nature. 448:484–487. - PMC - PubMed

Publication types

MeSH terms