

Optimal drug cocktail design: methods for targeting molecular ensembles and insights from theoretical model systems
- PMID: 18505239
- PMCID: PMC3548403
- DOI: 10.1021/ci700452r
Optimal drug cocktail design: methods for targeting molecular ensembles and insights from theoretical model systems
Abstract
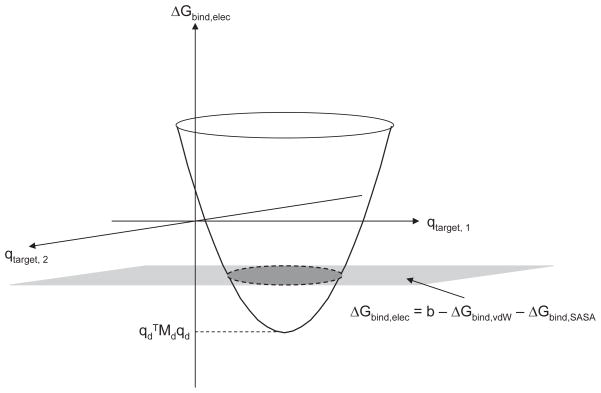
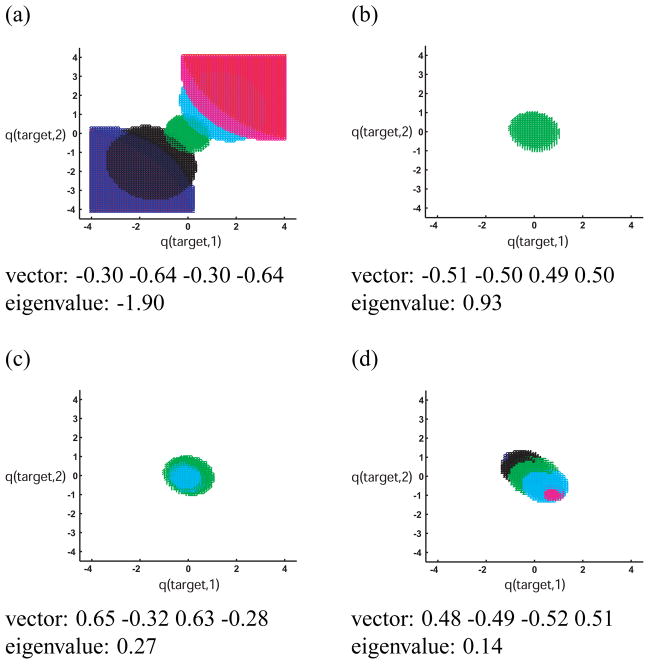
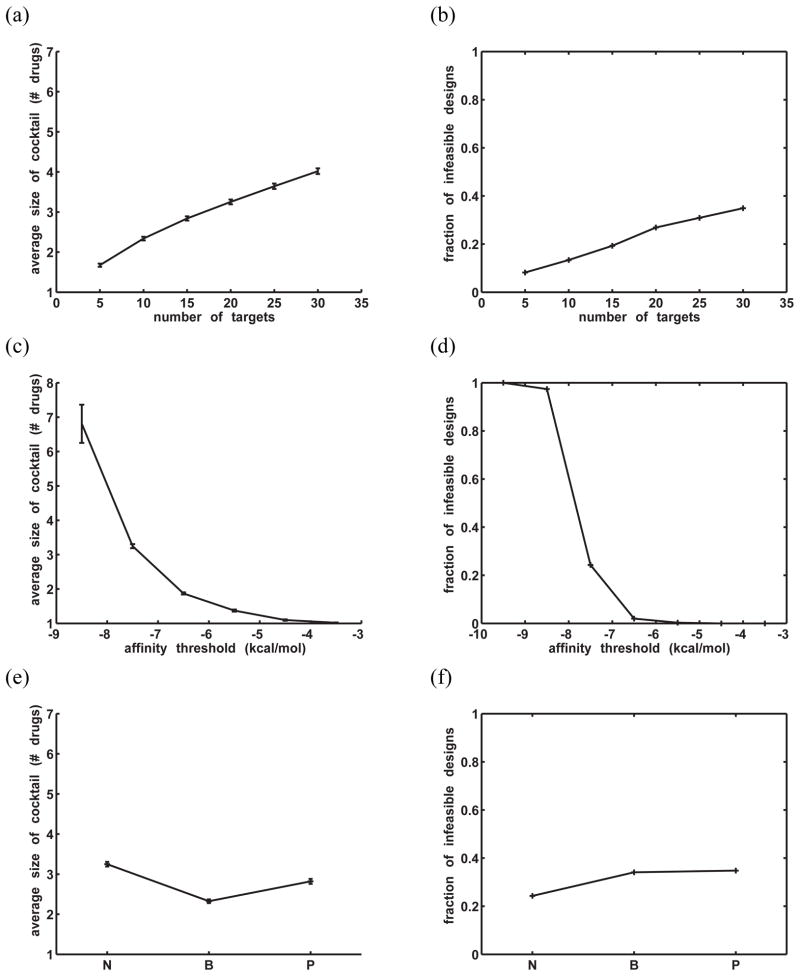
Drug resistance is a significant obstacle in the effective treatment of diseases with rapidly mutating targets, such as AIDS, malaria, and certain forms of cancer. Such targets are remarkably efficient at exploring the space of functional mutants and at evolving to evade drug binding while still maintaining their biological role. To overcome this challenge, drug regimens must be active against potential target variants. Such a goal may be accomplished by one drug molecule that recognizes multiple variants or by a drug "cocktail"--a small collection of drug molecules that collectively binds all desired variants. Ideally, one wants the smallest cocktail possible due to the potential for increased toxicity with each additional drug. Therefore, the task of designing a regimen for multiple target variants can be framed as an optimization problem--find the smallest collection of molecules that together "covers" the relevant target variants. In this work, we formulate and apply this optimization framework to theoretical model target ensembles. These results are analyzed to develop an understanding of how the physical properties of a target ensemble relate to the properties of the optimal cocktail. We focus on electrostatic variation within target ensembles, as it is one important mechanism by which drug resistance is achieved. Using integer programming, we systematically designed optimal cocktails to cover model target ensembles. We found that certain drug molecules covered much larger regions of target space than others, a phenomenon explained by theory grounded in continuum electrostatics. Molecules within optimal cocktails were often dissimilar, such that each drug was responsible for binding variants with a certain electrostatic property in common. On average, the number of molecules in the optimal cocktails correlated with the number of variants, the differences in the variants' electrostatic properties at the binding interface, and the level of binding affinity required. We also treated cases in which a subset of target variants was to be avoided, modeling the common challenge of closely related host molecules that may be implicated in drug toxicity. Such decoys generally increased the size of the required cocktail and more often resulted in infeasible optimizations. Taken together, this work provides practical optimization methods for the design of drug cocktails and a theoretical, physics-based framework through which useful insights can be achieved.
Figures


Similar articles
-
Multiple drugs and multiple targets: an analysis of the electrostatic determinants of binding between non-nucleoside HIV-1 reverse transcriptase inhibitors and variants of HIV-1 RT.Proteins. 2012 Feb;80(2):573-90. doi: 10.1002/prot.23221. Epub 2011 Nov 17. Proteins. 2012. PMID: 22095671
-
Specificity in molecular design: a physical framework for probing the determinants of binding specificity and promiscuity in a biological environment.J Phys Chem B. 2007 Nov 29;111(47):13419-35. doi: 10.1021/jp074285e. Epub 2007 Nov 3. J Phys Chem B. 2007. PMID: 17979267 Free PMC article.
-
Application of Constrained Optimization Methods in Health Services Research: Report 2 of the ISPOR Optimization Methods Emerging Good Practices Task Force.Value Health. 2018 Sep;21(9):1019-1028. doi: 10.1016/j.jval.2018.05.003. Value Health. 2018. PMID: 30224103
-
Adaptive inhibitors of the HIV-1 protease.Prog Biophys Mol Biol. 2005 Jun;88(2):193-208. doi: 10.1016/j.pbiomolbio.2004.07.005. Prog Biophys Mol Biol. 2005. PMID: 15572155 Review.
-
[Development of antituberculous drugs: current status and future prospects].Kekkaku. 2006 Dec;81(12):753-74. Kekkaku. 2006. PMID: 17240921 Review. Japanese.
Cited by
-
SuperCYP: a comprehensive database on Cytochrome P450 enzymes including a tool for analysis of CYP-drug interactions.Nucleic Acids Res. 2010 Jan;38(Database issue):D237-43. doi: 10.1093/nar/gkp970. Epub 2009 Nov 24. Nucleic Acids Res. 2010. PMID: 19934256 Free PMC article.
-
Searching for synergistic bronchodilators and novel therapeutic regimens for chronic lung diseases from a traditional Chinese medicine, Qingfei Xiaoyan Wan.PLoS One. 2014 Nov 14;9(11):e113104. doi: 10.1371/journal.pone.0113104. eCollection 2014. PLoS One. 2014. PMID: 25397687 Free PMC article.
-
Mono- and combinational drug therapies for global viral pandemic preparedness.iScience. 2022 Mar 17;25(4):104112. doi: 10.1016/j.isci.2022.104112. eCollection 2022 Apr 15. iScience. 2022. PMID: 35402870 Free PMC article. Review.
-
Countering amyloid polymorphism and drug resistance with minimal drug cocktails.Prion. 2010 Oct-Dec;4(4):244-51. doi: 10.4161/pri.4.4.13597. Epub 2010 Oct 12. Prion. 2010. PMID: 20935457 Free PMC article.
-
How to Model for a Living: The CSGF as a Catalyst for Supermodels.Comput Sci Eng. 2021 Nov-Dec;23(6):34-41. doi: 10.1109/mcse.2021.3119764. Epub 2021 Oct 14. Comput Sci Eng. 2021. PMID: 35600324 Free PMC article.
References
-
- Druker BJ, Tamura S, Buchdunger E, Ohno S, Segal GM, Fanning S, Zimmerman J, Lydon NB. Effects of a Selective Inhibitor of the Abl Tyrosine Kinase on the Growth of Bcr-Abl Positive Cells. Nat Med. 1996;2:561–566. - PubMed
-
- Ottmann OG, Druker BJ, Sawyers CL, Goldman JM, Reiffers J, Silver RT, Tura S, Fischer T, Deininger MW, Schiffer CA, Baccarani M, Gratwohl A, Hochhaus A, Hoelzer D, Fernandes-Reese S, Gathmann I, Capdeville R, O’Brien SG. A Phase 2 Study of Imatinib in Patients with Relapsed or Refractory Philadephia Chromosome-Positive Acute Lymphoid Leukemias. Blood. 2002;100:1965–1971. - PubMed
-
- Little SJ, Holte S, Routy JP, Daar ES, Markowitz M, Collier AC, Koup RA, Mellors JW, Connick E, Conway B, Kilby M, Wang L, Whitcomb JM, Hellmann NS, Richman DD. Antiretroviral-Drug Resistance Among Patients Recently Infected with HIV. New Eng J Med. 2002;347:385–394. - PubMed
-
- Grant RM, Hecht FM, Warmerdam M, Liu L, Liegler T, Petropoulos CJ, Hellman NS, Chesney M, Busch MP, Kahn JO. Time Trends in Primary HIV-1 Drug Resistance Among Recently Infected Persons. J Amer Med Assoc. 2002;288:181–188. - PubMed
-
- Deeks SG. Treatment of Antiretroviral-Drug-Resistant HIV-1 Infection. Lancet. 2003;362:2002–2011. - PubMed
Publication types
MeSH terms
Substances
Grants and funding
LinkOut - more resources
Full Text Sources
