. 2010 Jan;14(1-2):275-89.
doi: 10.1111/j.1582-4934.2008.00368.x. Epub 2008 May 24.

Myoblasts from affected and non-affected FSHD muscles exhibit morphological differentiation defects

Affiliations

Myoblasts from affected and non-affected FSHD muscles exhibit morphological differentiation defects

Marietta Barro et al. J Cell Mol Med. 2010 Jan.

Abstract

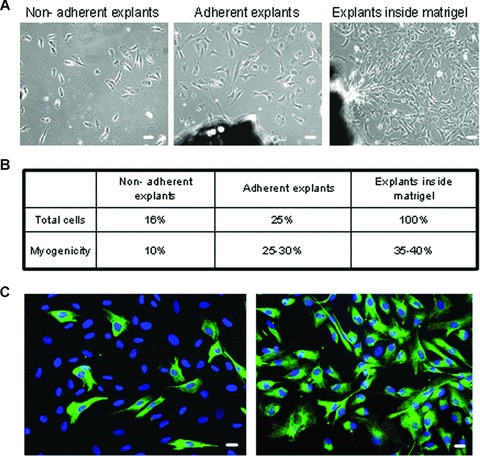
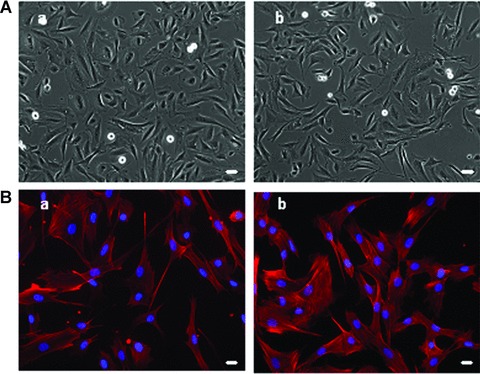
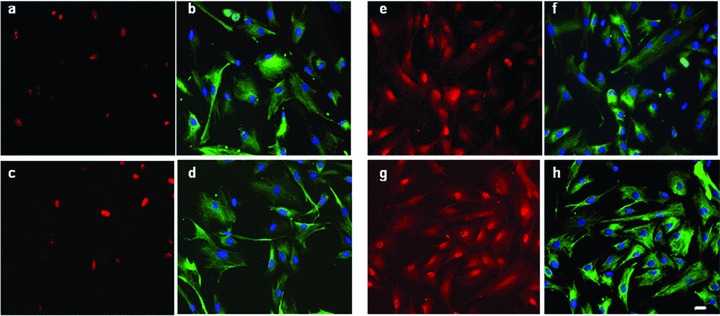
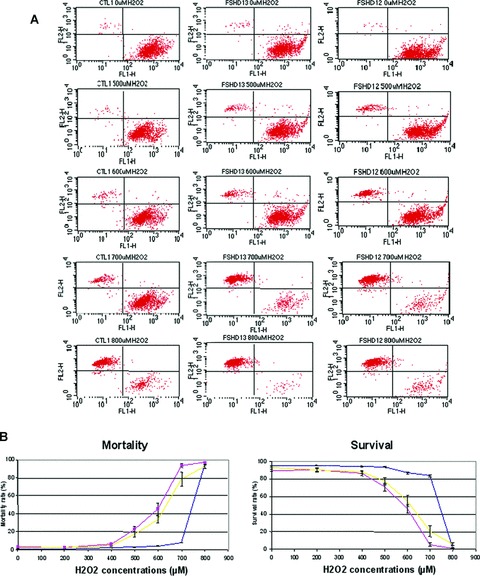
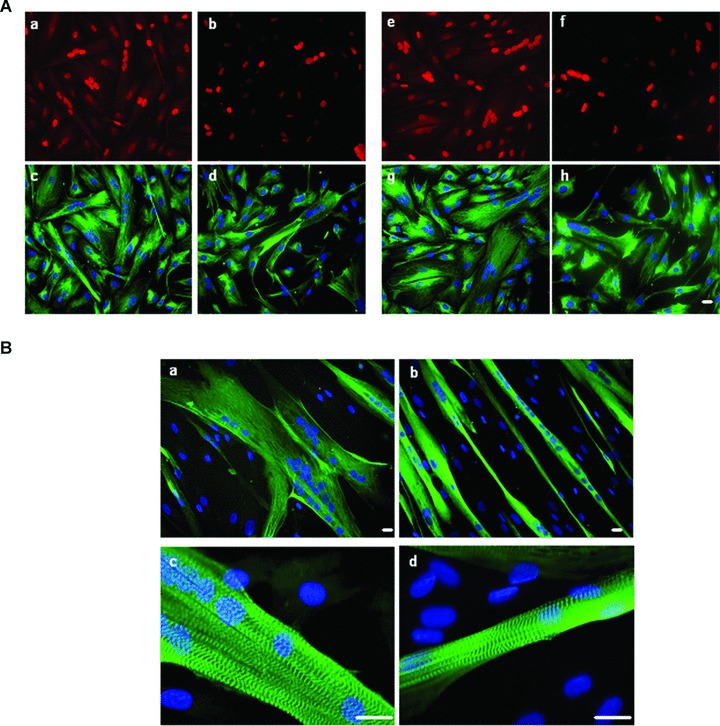
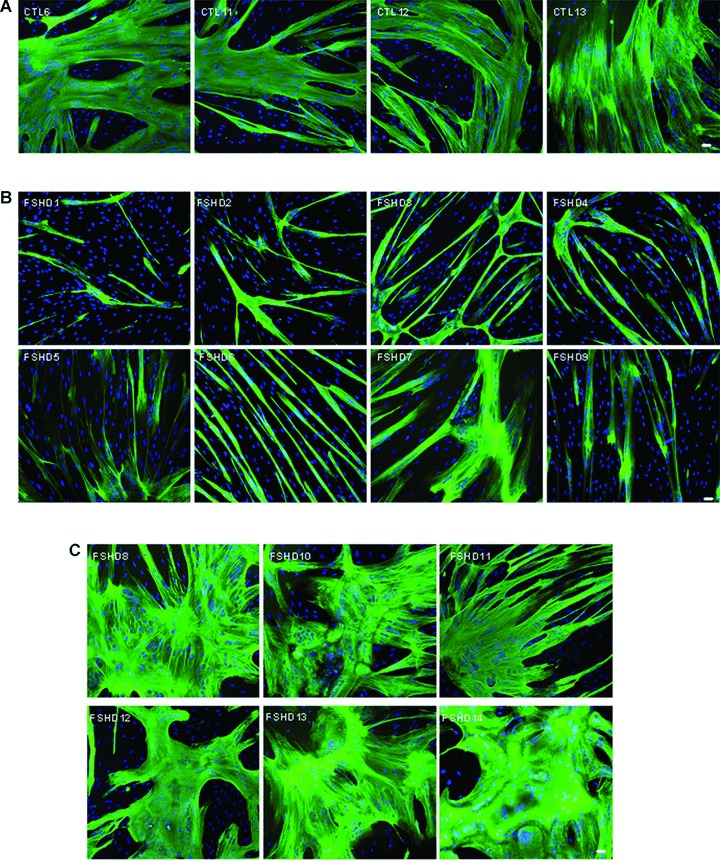
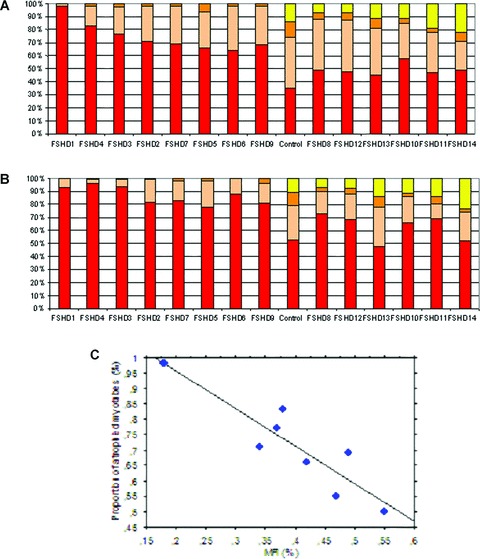
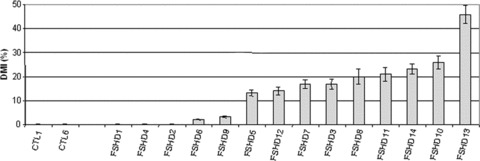
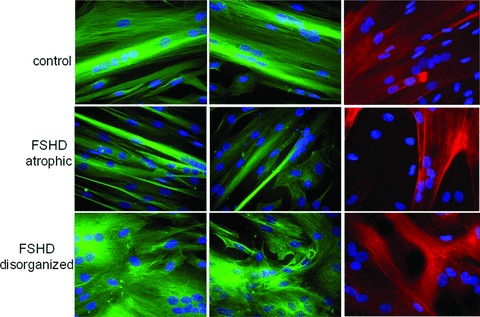
Facioscapulohumeral dystrophy (FSHD) is a muscular hereditary disease with a prevalence of 1 in 20,000 caused by a partial deletion of a subtelomeric repeat array on chromosome 4q. However, very little is known about the pathogenesis as well as the molecular and biochemical changes linked to the progressive muscle degeneration observed in these patients. Several studies have investigated possible pathophysiological pathways in FSHD myoblasts and mature muscle cells but some of these reports were apparently in contradiction. The discrepancy between these studies may be explained by differences between the sources of myoblasts. Therefore, we decided to thoroughly analyze affected and unaffected muscles from patients with FSHD in terms of vulnerability to oxidative stress, differentiation capacity and morphological abnormalities. We have established a panel of primary myoblast cell cultures from patients affected with FSHD and matched healthy individuals. Our results show that primary myoblasts are more susceptible to an induced oxidative stress than control myoblasts. Moreover, we demonstrate that both types of FSHD primary myoblasts differentiate into multi-nucleated myotubes, which present morphological abnormalities. Whereas control myoblasts fuse to form branched myotubes with aligned nuclei, FSHD myoblasts fuse to form either thin and branched myotubes with aligned nuclei or large myotubes with random nuclei distribution. In conclusion, we postulate that these abnormalities could be responsible for muscle weakness in patients with FSHD and provide an important marker for FSHD myoblasts.


Figures

Fig 1
Fig 1
Optimization of FSHD myoblast purification. (A) Phase contrast images of cells migrating away from non-adherent explants (left) adherent explants (middle) and explants in Matrigel (right), 10× magnification. (B) After 8 days of culture, cells were harvested and counted. The total number of released cells was arbitrary fixed to 100% for matrigel. Myogenicity was defined as the percentage of cells expressing desmin. (C) Immunofluorescence showing desmin positive cells (green) before and after MACS purification performed with CD56 antigen. Nuclei were revealed after DNA staining with DAPI (blue). 20× magnification, Bar = 10μm.
Fig 2
Fig 2
Comparative morphological analysis of control and FSHD myoblasts. (A) Phase contrast images of a representative control (a; CTL 6) and FSHD (b; FSHD13) myoblast culture showing that FSHD myoblasts have a normal morphology, 10× magnification. (B) Observation of actin microfilaments using phalloidin (red) and DAPI (blue) immunostaining on a representative control (a; CTL1) and a representative FSHD (b; FSHD3) myoblast cultures show normal cytoskeleton morphology, 20× magnification, bar = 10 μm. All these observations were done on the 14 CTL and FSHD myoblast cultures.
Fig 3
Fig 3
Characterization of FSHD and control cells proliferation. Representative images of a CTL (a, b, e, f; CTL1) and FSHD (c, d, g, h; FSHD13) showing co-immunofluorescence with anti-Ki67 (a, c; red) and anti-desmin (b,d; green), anti-MyoD (e, g; red) and anti-desmin (f, h; green) antibodies and DAPI nuclear staining (blue). MyoD and Ki67 are localized into the nucleus 20× magnification, bar = 10 μm. Experiments were performed on two controls and three FSHD cultures.
Fig 4
Fig 4
Comparative analysis of control and FSHD myoblasts response to H202-induced oxidative stress. (A) A representative flow cytometry analysis on myoblasts from one control (CTL1), one clinically affected FSHD (FSHD13) and one clinically unaffected FSHD (FSHD12). FACS experiments were conducted on FSHD and control myoblasts after 24 hrs exposure to increasing doses of H2O2. Live cells stained with calcein (green) were sorted with the FL1 channel (down-right window) and dead cells stained with ethidium homodimer-1 (red) were sorted with the FL2 channel (up-left window). (B) Flow cytometry analysis of myoblasts from all control (blue), unaffected FSHD (yellow) and affected FSHD (red). Experiments were performed twice on two independent cultures.
Fig 5
Fig 5
FSHD and control cells upon induction of differentiation. (A) A representative control (a, b, c, d; CTL7) and FSHD (e, f, g, h; FSHD4) culture at the onset of cell fusion: co-immunofluorescence with anti-myogenin (a,e; red) and anti-desmin (c, g; green), anti-p21 (b, f; red) and anti-desmin (d, h; green) antibodies and DAPI nuclear staining (blue), myogenin and P21 localize into the nucleus, 20× magnification. Experiments were performed on three controls and three FSHD cultures. (B) Terminal differentiation (day 6; see Materials and Methods) of a representative culture of CTL (a, c; CTL1) and FSHD (b, d; FSHD9) myotubes: immunofluorescence with either an anti-myosin (a, b; green) and DAPI nuclear staining (blue), 20× magnification, bar = 10 μm or with an anti-α-actinin (c, d; green) antibody and nuclear (blue) staining showing correct localization of these proteins in FSHD cells, 40× magnification, Bar × 10 μm. Experiments were performed on 11 controls and 12 FSHD cultures.
Fig 6
Fig 6
Myogenic Fusion Index (MFI) of FSHD and control cultures. MFI values range from 37% to 70% for both FSHD and control cell cultures, except for FSHD1 and FSHD14 (respectively, 18% and 85%). To calculate MFI, 10 fields per culture were counted in three independent cultures for each cell line.
Fig 7
Fig 7
Specific myotube phenotypes. Immunofluorescence with an anti-troponinT antibody (green) and DAPI nuclear staining (blue), 10× magnification, Bar = 20 μm. (A) CTL myotubes (only 4 out of 14 controls are depicted) showing normal human myotube morphology. (B) Myotubes from the FSHD atrophic group showing thinner myotubes. (C) Myotubes of the FSHD disorganized group showing larger myotubes with abnormal nuclei repartition.
Fig 8
Fig 8
Myotube characterization. (A) Bar graph representing the repartition of the number of nuclei per myotube for each FSHD culture and a representative control. Yellow: more than 50 nuclei; Orange: from 31 to 50 nuclei; Pink: from 11 to 30 nuclei; Red: from 3 to 10 nuclei. (B) Bar graph representing the repartition of the myotube diameters for each FSHD culture and a representative control. Yellow: more than 100 μm; orange: from 61 to 100 μm; pink: from 21 to 60 μm; red: from 0 to 20 μm. (C) Statistical analysis of FSHD cultures showing correlations between the proportion of atrophic myotubes and the MFI value (D).
Fig 9
Fig 9
Deformed Myotube Index (DMI) of FSHD and control cultures. DMI values were plotted and ranged from 17% to 40% in FSHD cultures.
Fig 10
Fig 10
Cytoskeleton status in controls and FSHD myotubes. Myotubes from control (CTL6), FSHD. (FSHD 2, a representative culture from atrophic group), and FSHD (FSHD13, a representative culture from disorganized group) were stained for α tubulin (green; left panels); β tubulin (green; middle panels) and actin using phalloidin (red; right panels). Nuclei were revealed using DAPI (blue) staining, 40× magnification, bar = 10 μm. Experiments were performed on two controls and three FSHD cultures in each group.

References

    1. Van Deutekom JC, Wijmenga C, Van Tienhoven EA, et al. FSHD associated DNA rearrangements are due to deletions of integral copies of a 3.2 kb tandemly repeated unit. Hum Mol Genet. 1993;2:2037–42. - PubMed
    1. Lee JH, Goto K, Matsuda C, et al. Characterization of a tandemly repeated 3.3-kb KpnI unit in the facioscapulohumeral muscular dystrophy (FSHD) gene region on chromosome 4q35. Muscle Nerve. 1995;2:S6–13. - PubMed
    1. Lunt PW, Jardine PE, Koch M, et al. Phenotypic-genotypic correlation will assist genetic counseling in 4q35-facioscapulohumeral muscular dystrophy. Muscle Nerve. 1995;2:S103–9. - PubMed
    1. Wijmenga C, Van Deutekom JC, Hewitt JE, et al. Pulsed-field gel electrophoresis of the D4F104S1 locus reveals the size and the parental origin of the facioscapulohumeral muscular dystrophy (FSHD)-associated deletions. Genomics. 1994;19:21–6. - PubMed
    1. Lunt PW, Jardine PE, Koch MC, et al. Correlation between fragment size at D4F104S1 and age at onset or at wheelchair use, with a possible generational effect, accounts for much phenotypic variation in 4q35-facioscapulohumeral muscular dystrophy (FSHD) Hum Mol Genet. 1995;4:951–8. - PubMed

Publication types

MeSH terms