. 2008 Aug 1;283(31):21540-9.
doi: 10.1074/jbc.M800214200. Epub 2008 May 26.

Apolipoprotein L1, a novel Bcl-2 homology domain 3-only lipid-binding protein, induces autophagic cell death

Affiliations

Apolipoprotein L1, a novel Bcl-2 homology domain 3-only lipid-binding protein, induces autophagic cell death

Guanghua Wan et al. J Biol Chem. .

Abstract

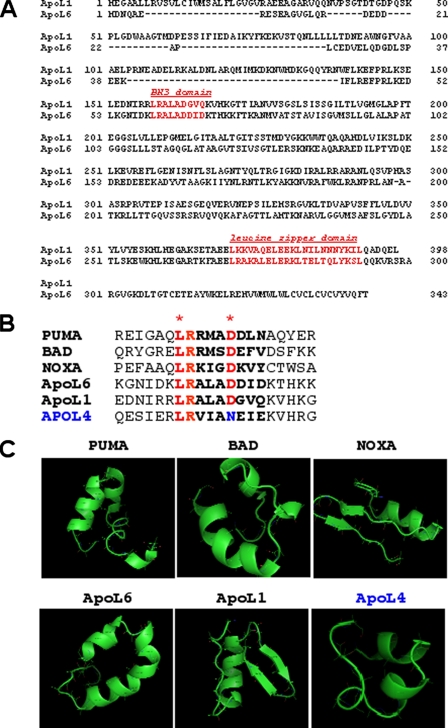
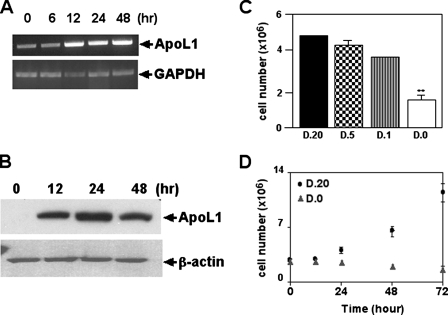
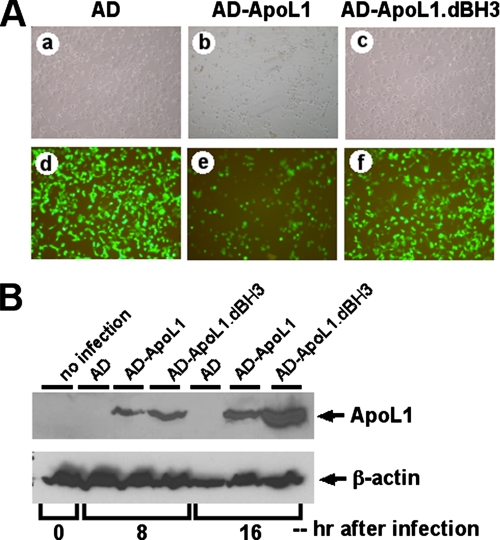
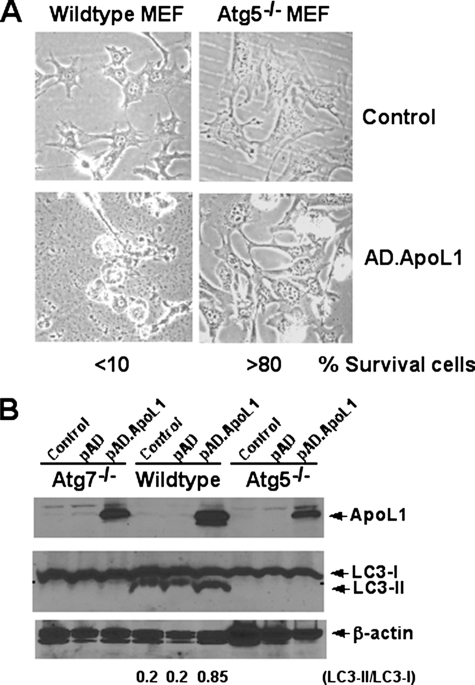
The Bcl-2 family proteins are important regulators of type I programmed cell death apoptosis; however, their role in autophagic cell death (AuCD) or type II programmed cell death is still largely unknown. Here we report the cloning and characterization of a novel Bcl-2 homology domain 3 (BH3)-only protein, apolipoprotein L1 (apoL1), that, when overexpressed and accumulated intracellularly, induces AuCD in cells as characterized by the increasing formation of autophagic vacuoles and activating the translocation of LC3-II from the cytosol to the autophagic vacuoles. Wortmannin and 3-methyladenine, inhibitors of class III phosphatidylinostol 3-kinase and, subsequently, autophagy, blocked apoL1-induced AuCD. In addition, apoL1 failed to induce AuCD in autophagy-deficient ATG5(-/-) and ATG7(-/-) mouse embryonic fibroblast cells, suggesting that apoL1-induced cell death is indeed autophagy-dependent. Furthermore, a BH3 domain deletion construct of apoL1 failed to induce AuCD, demonstrating that apoL1 is a bona fide BH3-only pro-death protein. Moreover, we showed that apoL1 is inducible by p53 in p53-induced cell death and is a lipid-binding protein with high affinity for phosphatidic acid (PA) and cardiolipin (CL). Previously, it has been shown that PA directly interacted with mammalian target of rapamycin and positively regulated the ability of mammalian target of rapamycin to activate downstream effectors. In addition, CL has been shown to activate mitochondria-mediated apoptosis. Sequestering of PA and CL with apoL1 may alter the homeostasis between survival and death leading to AuCD. To our knowledge, this is the first BH3-only protein with lipid binding activity that, when overproduced intracellularly, induces AuCD.


Figures

FIGURE 1.
FIGURE 1.
Sequence and domain analysis of human apoL1. A, polypeptide sequence alignment of human apoL1 and apoL6. Over all, apoL1 and apoL6 shows 27% identity and 42% similarity at the aa level. Putative domains in apoL1 include a BH3 domain (aa 158–166) and a leucine zipper domain (aa 365–392). B, sequence alignment of the 20-aa region containing putative BH3 domain in known BH3-only proteins (PUMA, BAD, NOXA, and apoL6) and apoL1 and apoL4. The 9-aa BH3 domain are in boldface and the two amino acids, L and D, which are conserved in all known BH3 domains, are labeled in red with asterisks. ApoL4 does not possess the conserved Asp residue, instead, it is substituted by an Asn (in blue). C, predicted tertiary structure of the 20-aa region containing putative BH3 domain in the indicated proteins. As expected, the 9-aa BH3 domains of known BH3-only proteins, PUMA, BAD, NOXA, and apoL6, show amphipathic α-helical structures. Importantly, the putative BH3 domain of apoL1 also possesses an α-helical domain. In contrast, apoL4 does not possess a complete, canonical α-helical structure in that region.
FIGURE 2.
FIGURE 2.
Time- and dose-dependent induction of apoL1 and cell death in DLD-1.ApoL1 cells. Induction of apoL1 expression is time-dependent as indicated by semi-quantitative RT-PCR using total RNA (A) or immunoblot analysis using total soluble proteins isolated from cells grown in induction medium (D.0) for the indicated time (B). C, apoL1 induces dose-dependent cell death. DLD-1.apoL1 cells were cultured in media containing Dox (D; ng/ml) as indicated. Attached cells were harvested and counted after 48 h. D, apoL1 induces time-dependent cell death. DLD-1.apoL1 cells were cultured in D.20 (Dox, 20 ng/ml) medium (squares) or D.0 (Dox, 0 ng/ml) medium (triangles), harvested, and counted at the times indicated. Each experiment was repeated at least three times. *, p < 0.05, indicates significant difference compared with control by Student's t test.
FIGURE 3.
FIGURE 3.
BH3 domain deletion construct of apoL1 failed to induce cell death in DLD-1 cells. A, adenoviruses harboring WT apoL1 (AD-apoL1) and BH3 domain deletion mutant of apoL1 (AD-apoL1.dBH3) were constructed and used to infect DLD-1 cells. Cells overexpressing green fluorescence protein also overexpressed apoL1 protein. AD-apoL1 induced cell death 72 h after infection (panels b (bright field) and e). In contrast, AD only or AD-apoL1.dBH3 failed to induce cell death (panels a (bright field) and d, and c (bright field) and f, respectively). B, time-dependent protein production of WT apoL1 and apoL1.dBH3. Hours after infection were as indicated. Note that endogenous expression of apoL1 was very low, almost undetectable, in DLD-1 cells (1st, 2nd, and 5th lanes). Both proteins were stably produced in time-dependent manner (3rd and 6th and 4th and 7th lanes for WT apoL1 and apoL1.dBH3, respectively). β-Actin was used as a loading control.
FIGURE 4.
FIGURE 4.
ApoL1-induced cell death is through autophagy, not by apoptosis. A, caspases 9 and 3 were not activated, and PARP was not cleaved during apoL1-induced cell death. By contrast, apoL6 induces cell death through apoptosis by activation of caspases 9 as described previously (45). B, apoL1 induced activation andtranslocationofLC3.ImmunoblotanalysisofLC3inautophagicDLD-1.apoL1 cells. Total soluble proteins were isolated at indicated time points from DLD-1.apoL1 cells cultured in induction medium. Times after induction of apoL1 are as indicated. Accumulation of LC3-II in induced DLD-1.apoL1 cells can be seen 12 h after induction. The ratios between LC3-II and LC3-I were 0.1, 2, and 20, 0, 12, and 24 h after induction, respectively. C, immunofluorescence staining of LC3 (red) in DLD-1.apoL1 cells. Panel a, DLD-1.apoL1 cells cultured in normal medium, and panel b, DLD-1.apoL1 cells cultured in induction medium for 24 h. At least 300 cells were analyzed for each experiment.
FIGURE 5.
FIGURE 5.
ApoL1 induces accumulation of AV and autophagic cell death, which can be inhibited by 3-MA and wortmannin. A, effect of 3-MA (5 mm) and wortmannin (1 μg/ml) on apoL1-induced cell death was observed by light microscopy analysis. 3-MA and wortmannin were added to noninduction medium 8 h prior to the induction of apoL1. Panel a, DLD-1.apoL1 cells in noninduction (regular) medium; panel b, in induction medium; panel c, in induction medium + 3-MA; and panel d, in induction medium + wortmannin. Obviously, 3-MA and wortmannin partially blunt apoL1-induced cell death in DLD-1.apoL1 cells by 55 and 40%, respectively. All the images were taken by the same inverted microscope (Olympus, CK40) with a MacroFire digital camera (OPTRONIC, model S99831). B, electron microscopy analysis of autophagic DLD-1.apoL1 cells. Panel a, control DLD-1.apoL1 cells; panels b and c, autophagic DLD-1.apoL1 cells under two different magnifications; panels d–f, magnified views of vacuoles in the cell shown in panel c. Panel d, an enlarged empty vacuole; panel e, a double-membraned structure presumably an autophagosome; panel f, an AV, presumably an autolysosome, engulfing an electron-dense body. Scale bars are as indicated. Data are representative of four experiments. Each experiment was repeated at least three times.
FIGURE 6.
FIGURE 6.
ApoL1 fails to induce cell death in autophagy-deficient ATG5-/- and ATG7-/- MEFs. Wild type (WT), ATG5-/-, and ATG7-/- MEF cells were grown in Dulbecco's modified Eagle's medium to 30% confluence, infected with control AD or AD-apoL1 viruses for 36 h, and followed by light microscopy analysis (A). Greater than 90% of WT MEF cells infected with AD-apoL1 had died, whereas less than 20% of the ATG5-/- or ATG7-/- (not shown) cells were dead. B, immunoblot analysis showed overexpression of apoL1 protein was achieved at 36 h after infection of AD-apoL1 in ATG7-/-, WT, and ATG5-/- MEFs. Importantly, apoL1 again induced activation of LC3 II and increased the ratio of LC3-II to LC3-I (6th lane). By contrast, apoL1 failed to induce activation of LC3 in the ATG5-/- and ATG7-/- cells. Of note, it has been reported that MEFs have high endogenous LC3-II (15, 16).
FIGURE 7.
FIGURE 7.
Expression of apoL1 is up-regulated by p53 in p53-induced cell death. Immunoblot analysis of time-dependent expression of apoL1 under the influence of p53 was assayed. Overexpression of p53 was achieved in DLD-1.p53 cells and in Hec50co cells as described previously (45). Hours after p53 overexpression are as indicated. Induction of apoL1 was detected 8 and 12 h after p53 overexpression in DLD-1.p53 cells and Hec50co cells, respectively. β-Actin was used as loading control.
FIGURE 8.
FIGURE 8.
Interacting lipid species of apoL1.FLAG protein. Affinity-purified apoL1.FLAG fusion protein was used to conduct lipid overlay assay (see “Experimental Procedures” for details). 3× FLAG peptide solution was used as a negative control. A, purified apoL1.FLAG was confirmed by immunoblot analysis using both anti-apoL1 and anti-FLAG antibodies. B, apoL1.FLAG bound strongly with CL and PA, followed by PI-3,5-P2, PI4P, PI5P, PI3P, PI-4,5-P2, PI-3,4,5-P3, PI-3,4-P2, 3-sulfogalactosylceramide (3-SGCer), phosphoserine, PG, and PI (very weak). ApoL1.FLAG did not bind cholesterol (CHO), TG, PE, PC, SM, diacylglycerol (DAG), sphingosine 1-phosphate, lysophosphatidic acid (LPA), and lysophosphocholine (LPC). Lipid abbreviations are as follows: TG (triglyceride), PI (phosphatidylinositol), DAG (diacylglycerol), PI4P (PtdIns(4)P), PA (phosphatidic acid), PI4,5P2 (PtdIns(4,5)P2), PS (phosphatidylserine), PI3,4,5P3 (PtdIns(3,4,5)P3), PE (phosphatidylethanolamine), CHO (cholesterol), PC (phosphatidylcholine), SM (sphingomyelin), PG (phosphatidylglycerol), 3-SGCer (3-sulfogalactosylceramide (Sulfatide)), CL (cardiolipin), S1P (sphingosine 1-phosphate), LPA (lysophosphatidic acid), LPC (lysophosphocholine), PI3,4P3 (PtdIns(3,4)P2), PI3,5P2 (PtdIns(3,5)P2), PI3P (PtdIns(3)P), PI4P (PtdIns(4)P), PI5P (PtdIns(5)P), and Solvent blank (Blank).
FIGURE 9.
FIGURE 9.
Hypothetical model of apoL1-induced autophagic death in cancer cells. Expression of apoL1 is inducible by p53, a tumor suppressor gene. Intracellular accumulation of apoL1 alters lipid homeostasis and signaling, induces activation and translocation of LC3, and generation of autophagic vacuoles leading to cell death. Inhibitors of autophagy, such as 3-MA or wortmannin, blunt apoL1-induced autophagic cell death.

References

    1. Tsujimoto, Y. (2003) J. Cell. Physiol. 195 158-167 - PubMed
    1. Adams, J. M., and Cory, S. (2007) Curr. Opin. Immunol. 19 488-496 - PMC - PubMed
    1. Scorrano, L., and Korsmeyer, S. J. (2003) Biochem. Biophys. Res. Commun. 304 437-444 - PubMed
    1. Huang, D. C., and Strasser, A. (2000) Cell 103 839-842 - PubMed
    1. Chipuk, J. E., Bouchier-Hayes, L., and Green, D. R. (2006) Cell Death Differ. 13 1396-1402 - PubMed

Publication types

MeSH terms