. 2008 Aug;17(8):1326-35.
doi: 10.1110/ps.035402.108. Epub 2008 May 27.

Probing the binding mechanism and affinity of tanezumab, a recombinant humanized anti-NGF monoclonal antibody, using a repertoire of biosensors

Affiliations

Probing the binding mechanism and affinity of tanezumab, a recombinant humanized anti-NGF monoclonal antibody, using a repertoire of biosensors

Yasmina Noubia Abdiche et al. Protein Sci. 2008 Aug.

Abstract

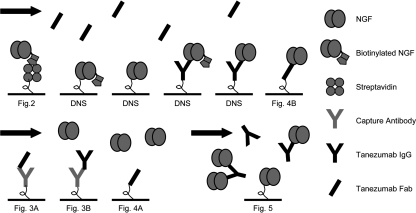
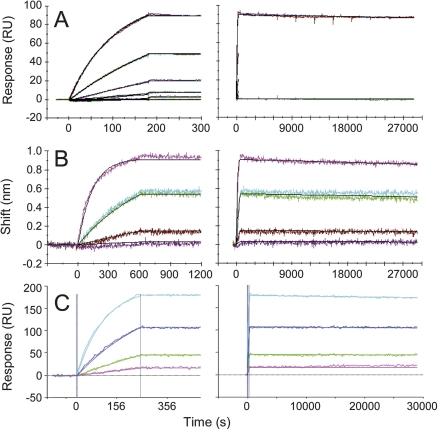
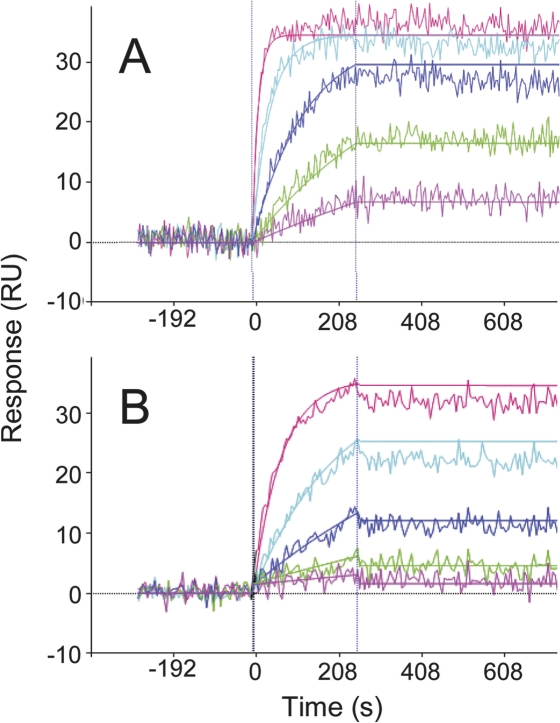
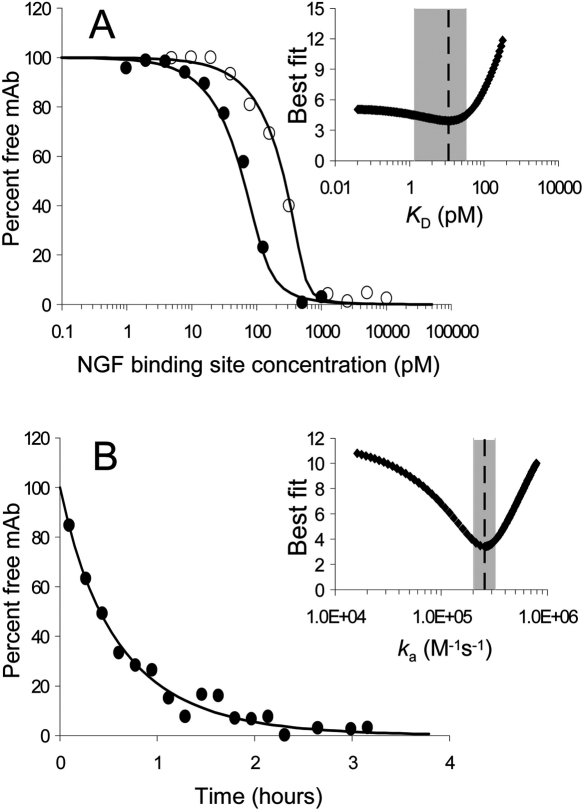
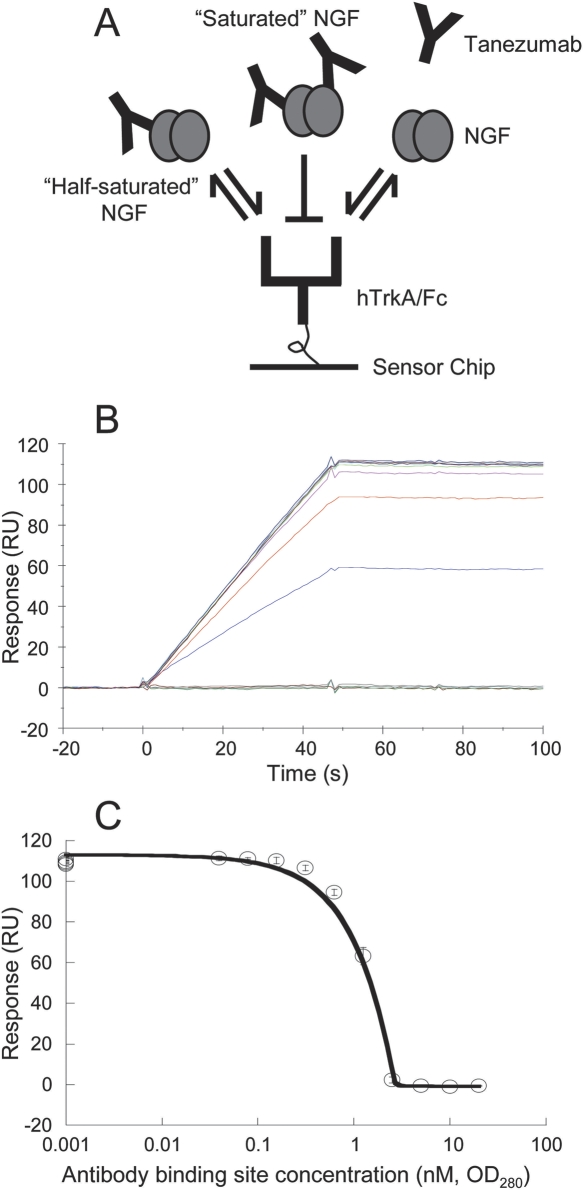
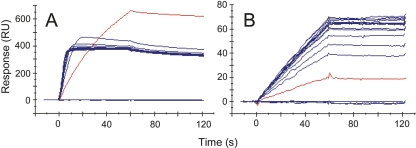
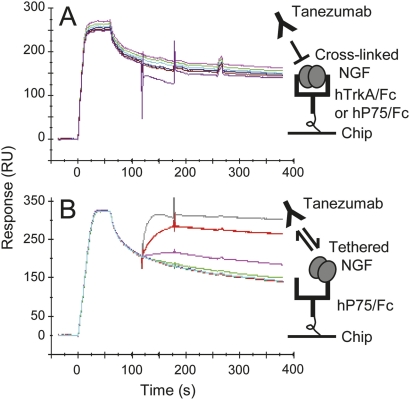
We describe the use of four complementary biosensors (Biacore 3000, Octet QK, ProteOn XPR36, and KinExA 3000) in characterizing the kinetics of human nerve growth factor (NGF) binding to a humanized NGF-neutralizing monoclonal antibody (tanezumab, formerly known as RN624). Tanezumab is a clinical candidate as a therapy for chronic pain. Our measurements were consistent with the NGF/tanezumab binding affinity being tighter than 10 pM due to the formation of an extremely stable complex that had an estimated half-life exceeding 100 h, which was beyond the resolution of any of our methods. The system was particularly challenging to study because NGF is an obligate homodimer, and we describe various assay orientations and immobilization methods that were used to minimize avidity in our experiments while keeping NGF in as native a state as possible. We also explored the interactions of NGF with its natural receptors, TrkA and P75, and how tanezumab blocks them. The Biacore blocking assay that we designed was used to quantify the potency of tanezumab and is more precise and reproducible than the currently available cell-based functional assays.


Figures

Figure 1.
Figure 1.
The various strategies used to immobilize ligands in kinetic experiments. The primary ligand was always amine-coupled to the surface. (Upper panel) Tanezumab Fab flowed over NGF on chip. (Bottom left panel) NGF flowed over tanezumab on chip. (Bottom right panel) Native tanezumab IgG and NGF were incubated together, and then free antibody-binding sites were detected via NGF-coated beads on the KinExA. (DNS) Data not shown.
Figure 2.
Figure 2.
Global kinetic analysis of tanezumab Fab binding minimally biotinylated NGF on the sensor using Biacore 3000 (A), Octet (B), and ProteOn XPR36 (C) platforms. (Left panel) Enlarged view of the association phase data shown in the right panel. The mean association rate constants (k a) and standard deviation for n-independent experiments were determined to be 3.5 ± 0.2 × 10⁵ M−1s−1 (n = 2) (A) and 3.6 ± 0.9 × 10⁵ M−1s−1 (n = 5) (B). In panel C, the globally fit k a was 4.51 ± 0.02 × 10⁵ M−1s−1, where the standard error is for the fit. The Fab concentrations analyzed in panels AC spanned 0.35–28, 0.17–21.6, and 0.49–13 nM, respectively. (Right panels) No decay in the binding signal was detected over 8 h irrespective of the biosensor used, so the k d was <2 × 10⁻⁶ s−1 and the K D was <8 pM. In panel B, the dissociation buffer contained 656 nM free NGF-binding sites to prevent any dissociated tanezumab Fab from rebinding to the NGF-coated tips. Colored and black lines in the overlay plots distinguish the measured data from the simulated fits in panels A and B, whereas noisy and smooth lines contrast the measured and simulated data in C.
Figure 3.
Figure 3.
Global kinetic analysis of NGF binding low-capacity tanezumab surfaces by Biacore. (A) NGF (0, 0.6, 1.8, 5.5, 16.4, and 49.2 nM binding sites) was injected over tanezumab Fab captured via pre-immobilized anti-human (H+L)-specific polyclonal. (B) The same NGF series analyzed over full-length tanezumab IgG captured on a similar surface. The mean k a values from A and B were indistinguishable from one another (1.8 ± 0.2 × 10⁶ M−1s−1, where the error is the standard deviation for three independent experiments on each surface). No dissociation was detected over 5 min, so the k d was <2 × 10⁻⁴ s−1 and the K D was <100 pM. Colored lines contrast the measured data from the simulated fits (black).
Figure 4.
Figure 4.
One-shot kinetics on the ProteOn to address the stepwise saturation of NGF by tanezumab Fab. (A) 0.8–65.6 nM NGF-binding sites reacting with low-capacity tanezumab Fab amine-coupled to the chip. (B) 0.2–16.8 nM tanezumab Fab binding NGF that is tethered via pre-immobilized tanezumab Fab on chip. The k a values obtained for A and B in a single experiment were virtually identical to one another (1.094 ± 0.002 × 10⁶ and 9.035 ± 0.009 × 10⁵ M−1s−1, respectively), with the errors being for a global fit of three surfaces for each assay orientation tested (data from only the lowest capacity surface is shown). Noisy and smooth lines distinguish the measured data from the simulated fits. Based on there being no detectable decay in the binding signal over 8 h (data not shown), k d < 2 × 10⁻⁶ s−1 and K D < 2 pM for both interactions.
Figure 5.
Figure 5.
KinExA analysis of the NGF/tanezumab interaction. (A) K D determination using a dual curve analysis of 0.488 pM–10 nM NGF titrated in twofold increments into intact tanezumab IgG at 400 pM (open circles) or 80 pM (solid circles) binding sites under equilibrium conditions; K D < 11.2 pM (dotted line in inset) with a broad 95% confidence interval (1.37–32 pM, gray box in inset), indicating that the calculated K D was not precise. (B) On rate determination of 600 pM tanezumab reacting with 2 nM NGF sampled every 10 min for 4 h under pre-equilibrium conditions; k a = 2.7 × 10⁵ M−1s−1 (dotted line in inset) with a sharp, well-defined 95% confidence interval (2.1–3.4 × 10⁵ M−1s−1, gray box in inset), using the empirically determined active NGF concentration of 785 pM. (Insets) Error graphs. The deduced k d was 3.0 × 10⁻⁶ s−1. All reagent concentrations are in binding sites.
Figure 6.
Figure 6.
Solution competition to determine the active concentration of tanezumab by Biacore. (A) Cartoon depicting the assay strategy used. (B) Primary data for a typical analysis of 6 nM NGF (binding sites) premixed with 80 pM–40 nM (binding sites) tanezumab IgG (concentrations based on OD280) and injected over TrkA/Fc on chip. (C) Inhibition curve for three independent analyses. The symbols and error bars represent the mean binding responses and standard deviation recorded at the end of the association phase; the standard deviations were <5%. Concentrations are in binding sites. The NGF was determined to be 88% ± 5% active (standard error for the fit).
Figure 7.
Figure 7.
Solution competition to reveal the stoichiometry of tanezumab in its blocking of NGF binding TrkA on a Biacore chip. (A) Injections of 197 nM NGF (binding sites) premixed with 0.37–400 nM tanezumab IgG (binding sites). (B) A 50-fold dilution of the samples in A. The red lines indicate 1:1 binding stoichiometry. The assay strategy was the same as that shown in the cartoon in Figure 6A.
Figure 8.
Figure 8.
Tanezumab binding to NGF that is first captured via pre-immobilized TrkA (5950RU) (A) or P75 (1940RU) (B) on a Biacore chip. NGF dimer (24.6 nM in A or 12.3 nM in B) and tanezumab IgG (4.8–3000 nM dimer) were injected sequentially at times 0 and 120 s, respectively. Concentrations are given in molecules. The cartoons depict the assay strategy used and the presumptive binding of NGF in a “cross-linked” mode (A) or a “tethered” mode (B) to the receptor on chip.

References

    1. Bravman, T., Bronner, V., Lavie, K., Notcovich, A., Papalia, G.A., Myszka, D.G. Exploring “one-shot” kinetics and small molecule analysis using the ProteOn XPR36 array biosensor. Anal. Biochem. 2006;358:281–288. - PubMed
    1. Cannon, M.J, Myszka, D.G., Bagnato, J.D., Alpers, D.H., West, F.G., Grissom, C.B. Equilibrium and kinetic analyses of the interactions between vitamin B12 binding proteins and cobalamins by surface plasmon resonance. Anal. Biochem. 2002;305:1–9. - PubMed
    1. Cowan, W.M., Hamburger, V., Levi-Montalcini, R. The path to the discovery of nerve growth factor. Annu. Rev. Neurosci. 2001;24:551–600. - PubMed
    1. Darling, R.J., Brault, P.A. Kinetic exclusion assay technology: Characterization of molecular interactions. Assay Drug Dev. Technol. 2004;2:647–657. - PubMed
    1. Drake, A.W., Myszka, D.G., Klakamp, S.L. Characterizing high-affinity antigen/antibody complexes by kinetic- and equilibrium-based methods. Anal. Biochem. 2004;328:35–43. - PubMed

Publication types