Review
. 2008 Aug 15;112(4):965-74.
doi: 10.1182/blood-2008-02-130435. Epub 2008 May 27.

Whole genome scanning as a cytogenetic tool in hematologic malignancies

Affiliations
Review

Whole genome scanning as a cytogenetic tool in hematologic malignancies

Jaroslaw P Maciejewski et al. Blood. .

Abstract

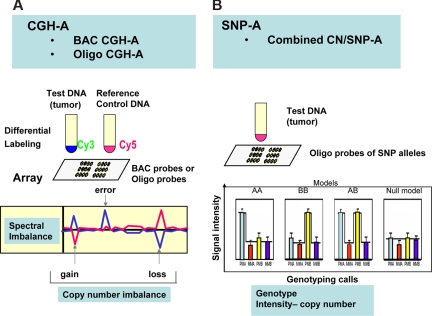
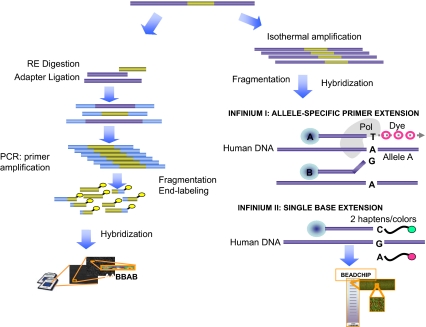
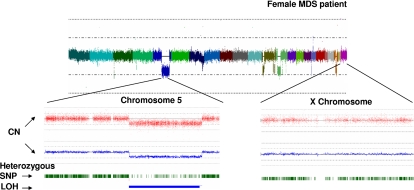
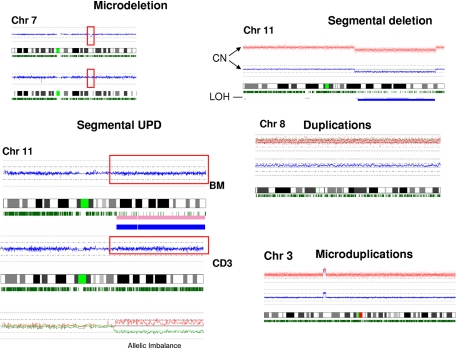
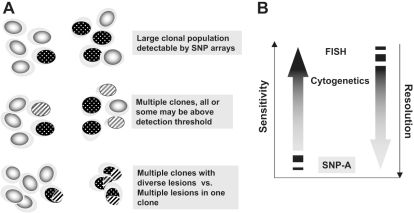
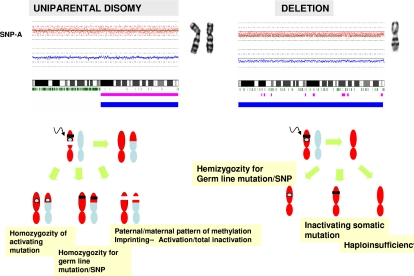
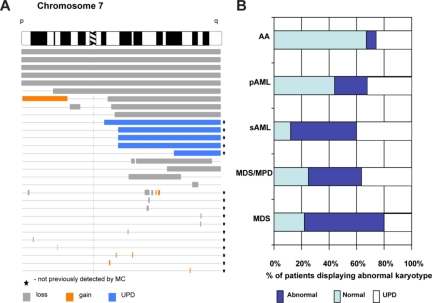
Over the years, methods of cytogenetic analysis evolved and became part of routine laboratory testing, providing valuable diagnostic and prognostic information in hematologic disorders. Karyotypic aberrations contribute to the understanding of the molecular pathogenesis of disease and thereby to rational application of therapeutic modalities. Most of the progress in this field stems from the application of metaphase cytogenetics (MC), but recently, novel molecular technologies have been introduced that complement MC and overcome many of the limitations of traditional cytogenetics, including a need for cell culture. Whole genome scanning using comparative genomic hybridization and single nucleotide polymorphism arrays (CGH-A; SNP-A) can be used for analysis of somatic or clonal unbalanced chromosomal defects. In SNP-A, the combination of copy number detection and genotyping enables diagnosis of copy-neutral loss of heterozygosity, a lesion that cannot be detected using MC but may have important pathogenetic implications. Overall, whole genome scanning arrays, despite the drawback of an inability to detect balanced translocations, allow for discovery of chromosomal defects in a higher proportion of patients with hematologic malignancies. Newly detected chromosomal aberrations, including somatic uniparental disomy, may lead to more precise prognostic schemes in many diseases.


Figures

Figure 1
Figure 1
Clonality in hematopoietic diseases. Chromosomal abnormalities or somatic mutations can be used as markers of clonality. Clonal defects (a pathogenic lesion or a marker indicative only of clonality) can be detected by, for example, SNP-A–based karyotyping (sensitivity problem) only if present in a significant proportion of cells. True malignant expansion of the dominant clone has to be contrasted with the clonality due to contraction of the cell compartment resulting in a recruitment of only one or a few stem cells at any given time.
Figure 2
Figure 2
General principles of CGH-A and SNP-A arrays. (A) In CGH-A, control DNA is used as reference for the test DNA obtained from putative tumor DNA. Analysis of spectra generated through hybridization of differentially labeled DNA to oligo or BAC probes on array is shown below. Decreased copy number in the tumor DNA results in decreased intensity of the signal for the test and increased signal for reference DNA. (B) In SNP-A, hybridization of amplified and labeled DNA to probes corresponding to alleles for each locus results in a genotyping pattern allowing for determination of the heterozygosity or homozygosity for each allele. At the same time, intensity of the hybridization signals allows for determination of copy number changes.
Figure 3
Figure 3
Principles of basic methods of SNP-A and its application for karyotyping. The generalized principle behind the technology used in Affymetrix SNP-A is shown in the left portion of the figure, whereas the bead array platform used by Illumina (San Diego, CA) is depicted in the right with both 1- and 2-color variants used in Infinium I and II arrays (Illumina). Below, the principle of genotyping based on the hybridization pattern for allelic probes is shown. For a detailed description, see “Single-nucleotide polymorphism arrays.”
Figure 4
Figure 4
Principle of bioinformatic analysis of array output. Analysis of hybridization signal intensity for each SNP probe allows for construction of karyograms. In this example, CNAG v.2 software (www.genome.umin.jp/CNAGtop2.html) was used for analysis: colors result from merging of individual signals grouped based on the topographic distribution throughout the genome and correspond to each of the autosomes and the X-chromosome. The hybridization signal intensity plot results in trace colors oscillating around the diploid signal intensity value. In the example shown, multiple areas of hypoploid signal intensity can be distinguished corresponding to several genomic losses. Zooming in on 2 exemplary chromosomes (5 and X, below the whole genome view) demonstrates the copy number determination plot (red dots symbolize hybridization signals of single SNP probes; blue line represents average copy number) as well as heterozygosity tracing depicted using individual green ticks (which merge when the density of heterozygosity calls is high). Areas of deletion are recognizable by the decrease in the hybridization signal intensity (below the diploid line) and corresponding decrease in the expected density of heterozygosity calls. Of note is that residual heterozygosity calls (here in an example of del5q31) correspond to signals derived from nonclonal cells contaminating the sample.
Figure 5
Figure 5
Examples of types of defects detected by SNP-A. Various types of chromosomal lesions detectable by SNP-A are presented, including microdeletions and microgains, large segmental or numeric gains, losses, and segmental acquired UPD. For demonstration purposes, the somatic nature of an exemplary microdeletion detected in bone marrow is demonstrated by comparison with sorted, nonclonal CD3 cells from the same patient. The karyogram of CD3 cells shows 2 normal chromosomes 7. Below, a similar demonstration is provided for an exemplary UPD with a disparity in the density of heterozygosity calls between clonal bone marrow sample and nonclonal sorted CD3 T cells.
Figure 6
Figure 6
The concepts of sensitivity and resolution in the context of SNP-A–based karyotyping, metaphase cytogenetics, and FISH. (A) Numerically large clones characterized by a chromosomal defect are easily detectable by SNP-A (top portion). The presence of clonal mosaicism may be detected if individual clones reach the detection threshold. Compound defects (bottom portion) cannot be distinguished by SNP-A from clonal mosaicism (middle portion). (B) Comparison of sensitivity (size of the clone) and resolution (size of the lesion) between SNP-A, metaphase cytogenetics, and FISH.
Figure 7
Figure 7
LOH and copy-neutral LOH and their consequences for the pathogenesis of malignant myeloid disorders. SNP-As facilitate detection of LOH. Two types of LOH are depicted using chromosome 7 as an example. SNP karyograms demonstrate monosomy-7 on the right and UPD7q on the left. In the bottom portion, theoretic pathogenetic pathways resulting in LOH due to deletion or UPD are shown. UPD can result in duplication of a somatic activating mutation, acquired homozygosity of a germ line–encoded polymorphism occurring normally in heterozygous form, or duplication of maternal or paternal methylation pattern with either activation or total inactivation of the duplicated allele. In deletion, the remaining allele may harbor a somatic inactivating mutation, leading to hemizygosity of a germ-line polymorphism that carries functional consequences or haploinsufficiency.
Figure 8
Figure 8
SNP-A karyotyping allows both mapping of invariant lesions and improvement of detection rate of cytogenetic abnormalities. (A) Mapping of chromosomal aberrations in myeloid malignancies. Karyograms generated by SNP-A allow for mapping of the location of chromosomal aberrations and delineation of minimal commonly deleted regions (as an example, topography of lesions on chromosome 7 is shown based on the analysis of a cohort of patients with AML and MDS). (B) Summary of the SNP-A karyotyping results. In representative studies of patients, including 78% of MDS, 75% of MPD/MDS, 87% of sAML, 30% of AA (M. Wlodarski, L. Gondek, C. L. O'Keefe, R. Tiu, A. Haddad, A. Risitano, J.P.M., manuscript submitted May 2008), and 56% of primary AML (R. Tiu, C. L. O'Keefe, M. Sekeres, M. A. McDevitt, J. Karp, J.P.M., manuscript submitted June 2008) patients were analyzed using SNP-A, and the rates of detection of chromosomal abnormalities, including UPD, were calculated.

References

    1. Grimwade D, Walker H, Oliver F, et al. The importance of diagnostic cytogenetics on outcome in AML: analysis of 1612 patients entered into the MRC AML 10 trial: The Medical Research Council Adult and Children's Leukaemia Working Parties. Blood. 1998;92:2322–2333. - PubMed
    1. Byrd JC, Mrozek K, Dodge RK, et al. Pretreatment cytogenetic abnormalities are predictive of induction success, cumulative incidence of relapse, and overall survival in adult patients with de novo acute myeloid leukemia: results from Cancer and Leukemia Group B (CALGB 8461). Blood. 2002;100:4325–4336. - PubMed
    1. Haase D, Germing U, Schanz J, et al. New insights into the prognostic impact of the karyotype in MDS and correlation with subtypes: evidence from a core dataset of 2124 patients. Blood. 2007;110:4385–4395. - PubMed
    1. Fenaux P. Chromosome and molecular abnormalities in myelodysplastic syndromes. Int J Hematol. 2001;73:429–437. - PubMed
    1. Sole F, Luno E, Sanzo C, et al. Identification of novel cytogenetic markers with prognostic significance in a series of 968 patients with primary myelodysplastic syndromes. Haematologica. 2005;90:1168–1178. - PubMed

Publication types