. 2008 Aug;76(8):3464-72.
doi: 10.1128/IAI.00037-08. Epub 2008 May 27.

Hypercholesterolemia impairs immunity to tuberculosis

Affiliations

Hypercholesterolemia impairs immunity to tuberculosis

Gregory W Martens et al. Infect Immun. 2008 Aug.

Abstract

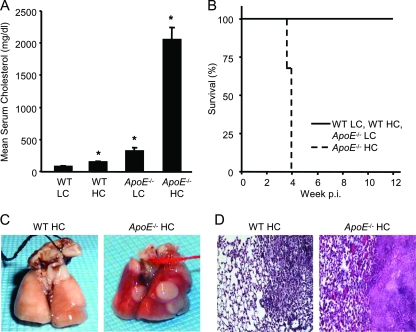
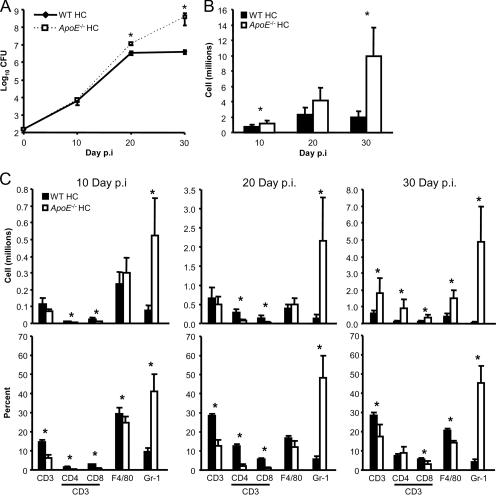
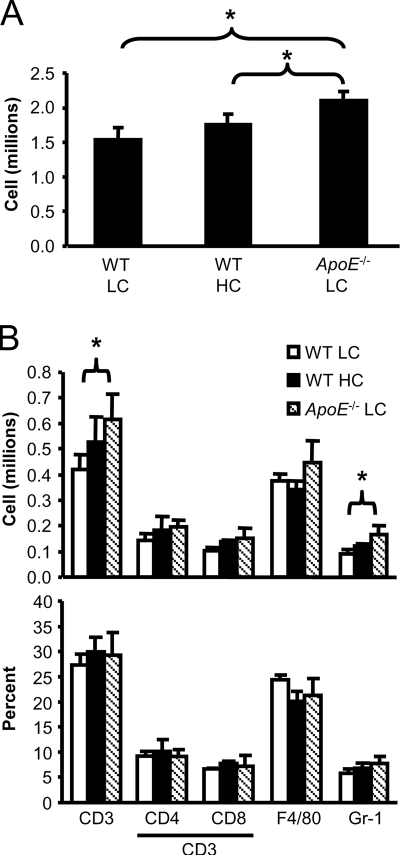
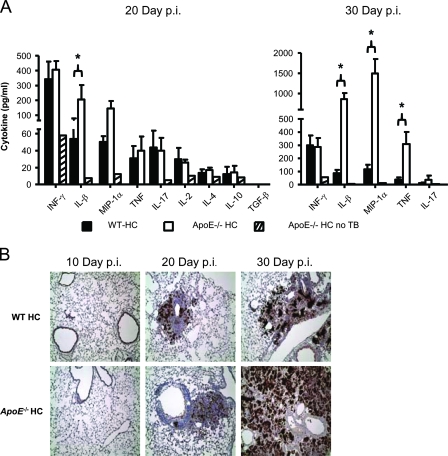
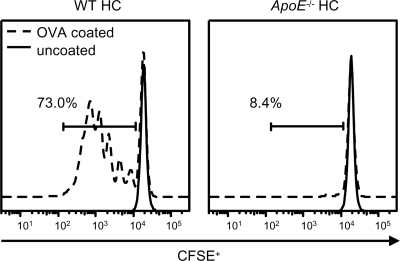
We demonstrate that apolipoprotein E -deficient (ApoE(-/-)) mice are highly susceptible to tuberculosis and that their susceptibility depends on the severity of hypercholesterolemia. Wild-type (WT) mice and ApoE(-/-) mice fed a low-cholesterol (LC) or high-cholesterol (HC) diet were infected with approximately 50 CFU Mycobacterium tuberculosis Erdman by aerosol. ApoE(-/-) LC mice were modestly more susceptible to tuberculosis than WT LC mice. In contrast, ApoE(-/-) HC mice were extremely susceptible, as evidenced by 100% mortality after 4 weeks with tuberculosis. The lung pathology of ApoE(-/-) HC mice was remarkable for giant abscess-like lesions, massive infiltration by granulocytes, elevated inflammatory cytokine production, and a mean bacterial load approximately 2 log units higher than that of WT HC mice. Compared to WT HC mice, the gamma interferon response of splenocytes restimulated ex vivo with M. tuberculosis culture filtrate protein was delayed in ApoE(-/-) HC mice, and they failed to control M. tuberculosis growth in the lung. OT-II cells adoptively transferred into uninfected ApoE(-/-) HC mice had a weak proliferative response to their antigen, indicating impaired priming of the adaptive immune response. Our studies show that ApoE(-/-) deficiency is associated with delayed expression of adaptive immunity to tuberculosis caused by defective priming of the adaptive immune response and that elevated serum cholesterol is responsible for this effect.


Figures

FIG. 1.
FIG. 1.
ApoE−/− HC mice are extremely susceptible to TB. (A) Serum cholesterol of WT and ApoE−/− mice after 2 weeks on an LC or HC diet. The values are means plus standard deviations. *, P < 0.05 WT HC, ApoE−/− LC, and ApoE−/− HC mice versus WT LC mice (n = 5). (B) Survival times of WT and ApoE−/− mice fed an LC or HC diet and then infected by aerosol with ∼50 CFU M. tuberculosis Erdman (n = 5). (C) Representative lungs from WT HC and ApoE−/− HC mice 30 days p.i. by aerosol with M. tuberculosis. (D) Representative lung tissue sections from WT HC and ApoE−/− HC mice 30 days after aerosol infection with ∼50 CFU M. tuberculosis stained with H&E (magnification, ×200). The results shown are representative of at least two independent experiments.
FIG. 2.
FIG. 2.
Despite a massive inflammatory response, ApoE−/− HC mice fail to control M. tuberculosis growth. (A) M. tuberculosis lung burdens of WT HC and ApoE−/− HC mice 10 days, 20 days, and 30 days after aerosol infection. The data are presented as mean log10 CFU ± standard deviations (SD). *, P < 0.05 (n = 4). (B) Lung leukocyte counts for the right caudal and left lung lobes of WT HC and ApoE−/− HC mice 10 days, 20 days, and 30 days after aerosol infection with M. tuberculosis. The values are the mean cell counts expressed in millions plus SD. *, P < 0.05 (n = 5). (C) The total numbers (top graphs) and percentages (bottom graphs) of T cells (CD3+ CD4+/CD8+), macrophages (F4/80+), or granulocytes (Gr-1+ CD3 F4/80) isolated from the right caudal and left lung lobes of WT HC and ApoE−/− HC mice 10 days, 20 days, and 30 days after aerosol infection with M. tuberculosis Erdman. The total number of each cell population was determined by multiplying the percentage of cells positive for the above-mentioned surface markers by the total number of lung leukocytes isolated from each mouse. The values are the mean numbers of cells expressed in millions plus SD. *, P < 0.05 (n = 5). The results shown are representative of one experiment per time point, except for the CFU data for day 30 p.i., which is representative of two independent experiments.
FIG. 3.
FIG. 3.
Lung inflammation increases with increasing serum cholesterol. (A) Lung leukocyte counts for the right caudal and left lung lobes of WT LC, WT HC, and ApoE−/− LC mice 12 weeks after aerosol infection with M. tuberculosis. The values are the mean numbers of cells expressed in millions plus standard deviations (SD). *, P < 0.05 (n = 5). (B) The total numbers (top graphs) and percentages (bottom graphs) of T cells (CD3+ CD4+/CD8+), macrophages (F4/80+), or granulocytes (Gr-1+ CD3 F4/80) isolated from the right caudal and left lung lobes of WT LC, WT HC, and ApoE−/− LC mice 12 weeks after aerosol infection with M. tuberculosis. The total number of each cell population was determined by multiplying the percentage of cells positive for the above-mentioned surface markers by the total number of lung leukocytes isolated from each mouse. The values are the mean numbers of cells expressed in millions plus SD. *, P < 0.05 (n = 4). The results shown are representative of one experiment.
FIG. 4.
FIG. 4.
Production of inflammatory cytokines in ApoE−/− HC lungs increases with the M. tuberculosis burden, while iNOS production is comparable to that in WT HC lungs. (A) Cytokine production in lung homogenates from WT HC and ApoE−/− HC mice 20 days or 30 days after aerosol infection with M. tuberculosis. The values are the mean cytokine concentrations expressed as pg/ml plus standard deviatons. *, P < 0.05 (n = 4). Lung homogenate from an uninfected ApoE−/− HC mouse was used as a background control. (B) Lung tissue sections from WT HC and ApoE−/− HC mice stained for iNOS production by immunohistochemistry 10 days, 20 days, and 30 days after aerosol infection with M. tuberculosis. Cells expressing iNOS are identified by brown staining; magnification, ×40. The lung sections shown are representative of three mice per mouse strain per time point. The results shown are representative of one experiment.
FIG. 5.
FIG. 5.
Delayed M. tuberculosis antigen-specific T-cell response in ApoE−/− HC mice. (A) Amounts of IFN-γ released by splenocytes 10 days, 20 days, and 30 days after aerosol infection with M. tuberculosis from WT HC and ApoE−/− HC mice that were cultured for 48 h with 2 μg/ml M. tuberculosis Erdman CFP. Individual measurements are shown, and the mean concentration is indicated with a solid line. Day 10 was below the lower limit of detection of 31 pg/ml. *, P < 0.05 (n = 5). (B) Splenocyte counts from WT HC and ApoE−/− HC mice 10 days, 20 days, and 30 days after aerosol infection with M. tuberculosis. The values are the mean splenocyte counts plus standard deviations (SD). *, P < 0.05 (n = 5). (C) The total numbers (top graphs) and percentages (bottom graphs) of T cells (CD3+ CD4+/CD8+), macrophages (F4/80+), or granulocytes (Gr-1+ CD3 F4/80) isolated from the spleens of WT HC and ApoE−/− HC mice 10 days, 20 days, and 30 days after aerosol infection with M. tuberculosis. The total number of each cell population was determined by multiplying the percentage of cells positive for the above-mentioned surface markers by the total number of splenocytes isolated from each mouse. The values are the mean numbers of cells expressed in millions plus SD. *, P < 0.05 (n = 4). The results shown for panels A and B are representative of two experiments, and the results for panel C are representative of one experiment.
FIG. 6.
FIG. 6.
In vivo antigen presentation is impaired in ApoE−/− HC mice. Shown are representative histograms of CFSE fluorescence of OT-II CD45.1+ CD4+ cells recovered from the left inguinal LN of WT HC and ApoE−/− HC mice. OT-II cells were stimulated in vivo for 3 days by s.c. injection of OVA-coated or uncoated iron beads near the left inguinal LN. The results are representative of three mice per group that were stimulated with OVA-coated beads; 66.6% and 13.4% of OT-II CD45.1+ CD4+ cells underwent ≥1 cell division in WT HC and ApoE−/− HC mice, respectively. *, P < 0.05 (n = 3). The results shown are representative of one experiment.

Comment in

References

    1. Alieke, G. V., N. de Bont, M. G. Netea, P. N. Demacker, J. W. van der Meer, A. F. Stalenhoef, and B. J. Kullberg. 2004. Apolipoprotein-E-deficient mice exhibit an increased susceptibility to disseminated candidiasis. Med. Mycol. 42341-348. - PubMed
    1. Angeli, V., J. Llodra, J. X. Rong, K. Satoh, S. Ishii, T. Shimizu, E. A. Fisher, and G. J. Randolph. 2004. Dyslipidemia associated with atherosclerotic disease systemically alters dendritic cell mobilization. Immunity 21561-574. - PubMed
    1. Barnden, M. J., J. Allison, W. R. Heath, and F. R. Carbone. 1998. Defective TCR expression in transgenic mice constructed using cDNA-based alpha- and beta-chain genes under the control of heterologous regulatory elements. Immunol. Cell Biol. 7634-40. - PubMed
    1. Bjorkbacka, H., V. V. Kunjathoor, K. J. Moore, S. Koehn, C. M. Ordija, M. A. Lee, T. Means, K. Halmen, A. D. Luster, D. T. Golenbock, and M. W. Freeman. 2004. Reduced atherosclerosis in MyD88-null mice links elevated serum cholesterol levels to activation of innate immunity signaling pathways. Nat. Med. 10416-421. - PubMed
    1. de Bont, N., M. G. Netea, P. N. Demacker, B. J. Kullberg, J. W. van der Meer, and A. F. Stalenhoef. 2000. Apolipoprotein E-deficient mice have an impaired immune response to Klebsiella pneumoniae. Eur. J. Clin. Investig. 30818-822. - PubMed

Publication types

MeSH terms