

Phenotypic plasticity and genotype by environment interaction for olfactory behavior in Drosophila melanogaster
- PMID: 18505870
- PMCID: PMC2429861
- DOI: 10.1534/genetics.108.086769
Phenotypic plasticity and genotype by environment interaction for olfactory behavior in Drosophila melanogaster
Abstract
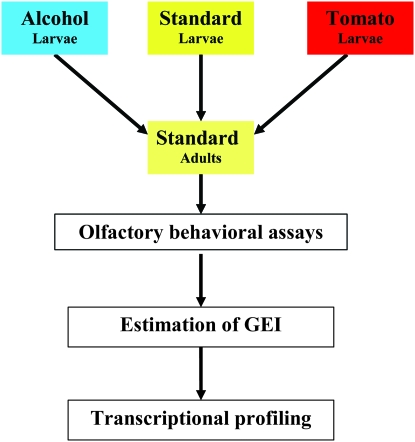
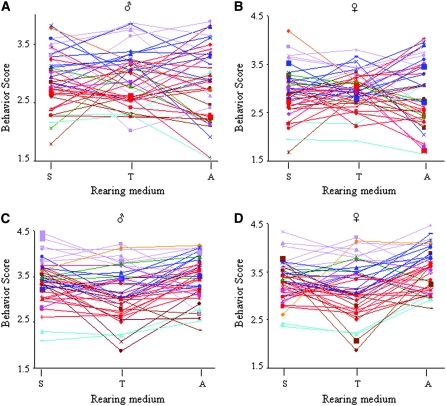
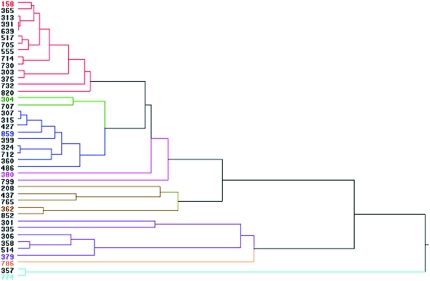
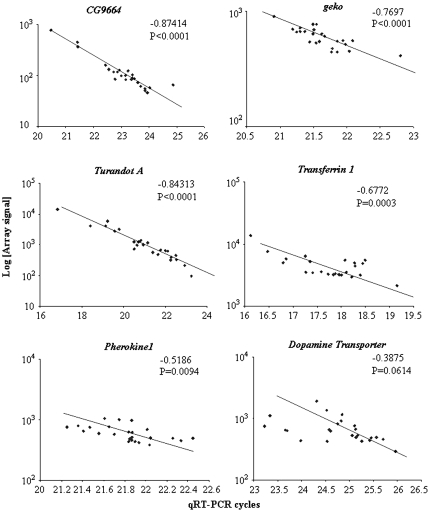
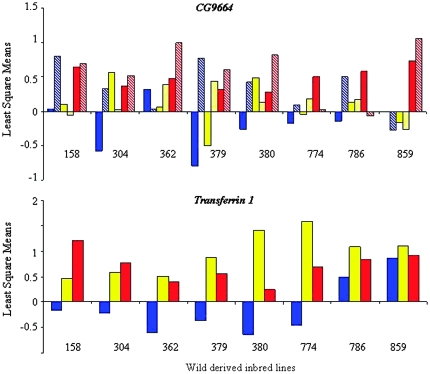
Genotype by environment interactions (GEI) play a major part in shaping the genetic architecture of quantitative traits and are confounding factors in genetic studies, for example, in attempts to associate genetic variation with disease susceptibility. It is generally not known what proportion of phenotypic variation is due to GEI and how many and which genes contribute to GEI. Behaviors are complex traits that mediate interactions with the environment and, thus, are ideally suited for studies of GEI. Olfactory behavior in Drosophila melanogaster presents an opportunity to systematically dissect GEI, since large numbers of genetically identical individuals can be reared under defined environmental conditions and the olfactory system of Drosophila and its behavioral response to odorants have been well characterized. We assessed variation in olfactory behavior in a population of 41 wild-derived inbred lines and asked to what extent different larval-rearing environments would influence adult olfactory behavior and whether GEI is a minor or major contributing source of phenotypic variation. We found that approximately 50% of phenotypic variation in adult olfactory behavior is attributable to GEI. In contrast, transcriptional analysis revealed that only 20 genes show GEI at the level of gene expression [false discovery rate (FDR) < 0.05], some of which are associated with physiological responses to environmental chemicals. Quantitative complementation tests with piggyBac-tagged mutants for 2 of these genes (CG9664 and Transferrin 1) demonstrate that genes that show transcriptional GEI are candidate genes for olfactory behavior and that GEI at the level of gene expression is correlated with GEI at the level of phenotype.
Figures
References
-
- Benjamini, Y., and Y. Hochberg, 1995. Controlling the false discovery rate: a practical and powerful approach to multiple testing. J. R. Stat. Soc. Ser. B 57 289–300.
-
- Caspi, A., J. McClay, T. E. Moffitt, J. Mill, J. Martin et al., 2002. Role of genotype in the cycle of violence in maltreated children. Science 297 851–854. - PubMed
-
- Caspi, A., K. Sugden, T. E. Moffitt, A. Taylor, I. W. Craig et al., 2003. Influence of life stress on depression: moderation by a polymorphism in the 5-HTT gene. Science 301 386–389. - PubMed
Publication types
MeSH terms
Substances
Grants and funding
LinkOut - more resources
Full Text Sources
Molecular Biology Databases
