. 2008 Jun;179(2):1089-100.
doi: 10.1534/genetics.107.085167. Epub 2008 May 27.

Inferring causal phenotype networks from segregating populations

Affiliations

Inferring causal phenotype networks from segregating populations

Elias Chaibub Neto et al. Genetics. 2008 Jun.

Abstract

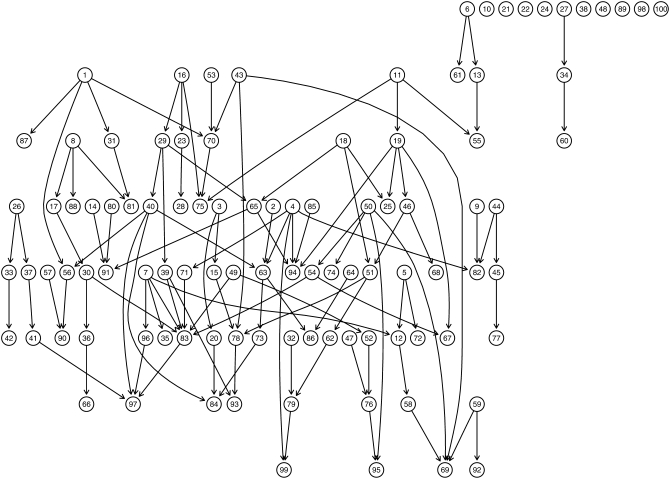
A major goal in the study of complex traits is to decipher the causal interrelationships among correlated phenotypes. Current methods mostly yield undirected networks that connect phenotypes without causal orientation. Some of these connections may be spurious due to partial correlation that is not causal. We show how to build causal direction into an undirected network of phenotypes by including causal QTL for each phenotype. We evaluate causal direction for each edge connecting two phenotypes, using a LOD score. This new approach can be applied to many different population structures, including inbred and outbred crosses as well as natural populations, and can accommodate feedback loops. We assess its performance in simulation studies and show that our method recovers network edges and infers causal direction correctly at a high rate. Finally, we illustrate our method with an example involving gene expression and metabolite traits from experimental crosses.


Figures

F<sc>igure</sc> 1.—
Figure 1.—
The causal network for three nodes (a) yields a Gaussian graphical model (GGM) using partial correlations (b). The edge between phenotypes 1 and 2 reflects partial correlation given 3, even though these two variables are causally independent. The undirected dependency graph (UDG) infers the correct edges (c) by first using the fact that 1 and 2 are uncorrelated to remove the 1–2 edge.
F<sc>igure</sc> 2.—
Figure 2.—
Distinguishing direct and indirect effects of a common QTL. Suppose that QTL mapping of phenotype y1 detected QTL q and q1 and mapping of phenotype y2 detected the common QTL q plus QTL q2. A strong QTL directly affecting an upstream trait may also be (incorrectly) detected as a QTL for a downstream phenotype. To resolve this situation we apply a generalization of Schadt et al. (2005), allowing for multiple QTL, where we score the three models above using BIC or AIC. Model a supports both traits being directly affected by the common QTL q. Model b implies that q directly affects y1 but should not be included as a QTL of phenotype y2. Model c supports the reverse situation. Observe that the assumption behind model a is that the correlation between y1 and y2 can be explained by the common QTL q, in addition to common environmental influences or other shared loci.
F<sc>igure</sc> 3.—
Figure 3.—
Randomly sampled sparse directed acyclic graph (DAG) composed of 100 nodes (phenotypes) connected by 107 edges, using the randomDAG function from the pcalg R package (R Development Core Team 2006). We generated data according to this network, adopting two or three QTL (not shown) per phenotype. This network demonstrates many features that can be inferred with varying degrees of difficulty by the PC algorithm. For instance, nodes organized in an unshielded collider pattern (Shipley 2002) such as formula image are easier to direct than nodes organized in a bifurcation or line pattern such as formula image and formula image. Figure 8 compares the performances of the QDG and PC algorithms for nodes involved in unshielded collider structures and all other remaining patterns pooled together. In supplemental Figures S2 and S3 we highlighted all nodes involved in unshielded collider patterns.
F<sc>igure</sc> 4.—
Figure 4.—
Cyclic graphs. (a) A single three-node cycle. (b) Two neighboring four-node cycles. (c) A reciprocal interaction cycle between nodes 2 and 5. This graph has two pairs of nodes (1, 5) and (2, 4) that are not directly connected but are d-connected (Pearl 1988).
F<sc>igure</sc> 5.—
Figure 5.—
Preserved neighborhoods for permutation P-value computation. The P-value for the arrow pointing from phenotype y1 to phenotype y2 depends on edges to neighboring nodes. x represents a covariate of both phenotypes (could be another phenotype, age, sex, etc.). z is a covariate of y1. q1 and q2 correspond to sets of QTL affecting y1 and y2, respectively. To break the connections (brk) that affect direction of an edge, we permute the corresponding pair of nodes (and their common covariates) as a block. In a we permute (y1, y2, x) as a block breaking the connections with z, q1, and q2; in b we incorrectly keep z in the permutation block. We keep the connections to a common covariate x to y1 and y2 in because of its role in improving the fit of the linear model.
F<sc>igure</sc> 6.—
Figure 6.—
Average percentage of discovered edges (PC skeleton) and average percentage of edges that could not be directed by the PC algorithm relative to the discovered edges for the network in Figure 3. Averages were computed across all edges in the network.
F<sc>igure</sc> 7.—
Figure 7.—
Average percentage of correctly inferred directions (a) and average percentage of incorrectly inferred directions (b) for the network in Figure 3. Averages were computed across all edges in the network.
F<sc>igure</sc> 7.—
Figure 7.—
Average percentage of correctly inferred directions (a) and average percentage of incorrectly inferred directions (b) for the network in Figure 3. Averages were computed across all edges in the network.
F<sc>igure</sc> 8.—
Figure 8.—
Comparison of the QDG and PC algorithms relative to the 69 edges involved in unshielded colliders and the other 38 edges involved in other patterns. (a and b) The averaged percentage of correct directions (across all nodes belonging to the respective pattern). (c) The averaged percentage of undirected edges in PC alone.
F<sc>igure</sc> 9.—
Figure 9.—
Comparison of the performance of the QDG method when all QTL (two or three per phenotype) were used to infer the directions vs. the performance of the QDG method using only one QTL (randomly selected from the two or three QTL used to generate the data). Averages were computed across all edges in the network in Figure 3.
F<sc>igure</sc> 10.—
Figure 10.—
Connected subset of the metabolite and gene expression causal network presented in Ferrara et al. (2008). Age and sex (not shown) were used as covariates in the causal orientation. Edges from Slc1a2 were reversed in the second-best network. Values on edges are the proportion of times the edge was recovered and the proportion of correct direction relative to the recovered edges.

Similar articles

Cited by

References

    1. Bing, N., and I. Hoeschele, 2005. Genetical genomic analysis of a yeast segregant population for transcription network inference. Genetics 170 533–542. - PMC - PubMed
    1. Brem, R. B., G. Yvert, R. Clinton and L. Kruglyak, 2002. Genetic dissection of transcriptional regulation in budding yeast. Science 296 752–755. - PubMed
    1. Chesler, E. J., L. Lu, S. Shou, Y. Qu, J. Gu et al., 2005. Complex trait analysis of gene expression uncovers polygenic and pleiotropic networks that modulate nervous system function. Nat. Genet. 37 233–242. - PubMed
    1. de la Fuente, A., N. Bing, I. Hoeschele and P. Mendes, 2004. Discovery of meaningful associations in genomic data using partial correlation coefficients. Bioinformatics 20 3565–3574. - PubMed
    1. Ferrara, C. T., P. Wang, E. Chaibub Neto, R. D. Stevens, J. R. Bain et al., 2008. Genetic networks of liver metabolism revealed by integration of metabolic and transcriptomic profiling. PLoS Genet. 4 e1000034. - PMC - PubMed

Publication types