Review
. 2008 Aug;130(2):235-45.
doi: 10.1007/s00418-008-0444-5. Epub 2008 May 28.

Imaging aspects of cardiovascular disease at the cell and molecular level

Affiliations
Review

Imaging aspects of cardiovascular disease at the cell and molecular level

Douglas J Taatjes et al. Histochem Cell Biol. 2008 Aug.

Abstract

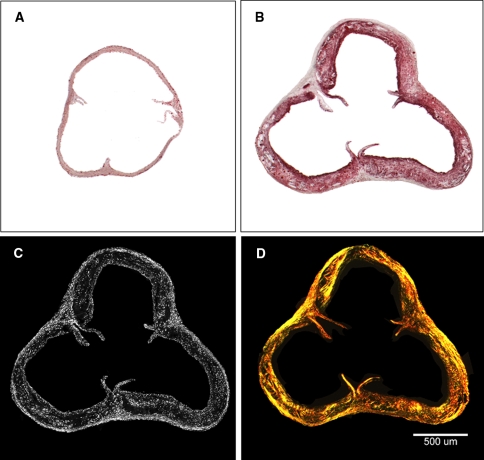
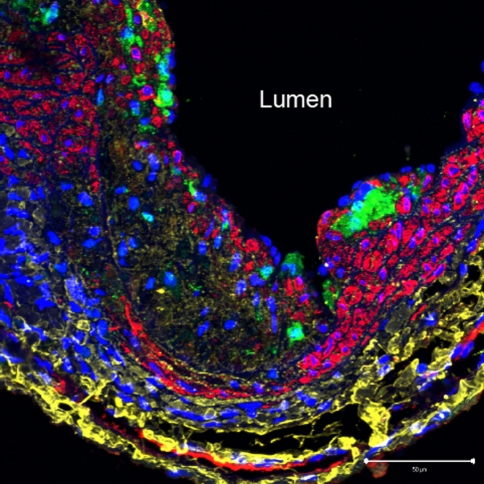
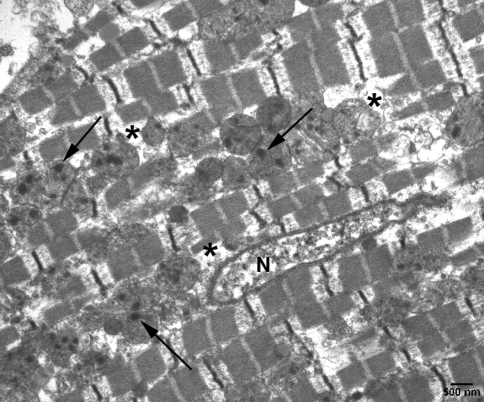
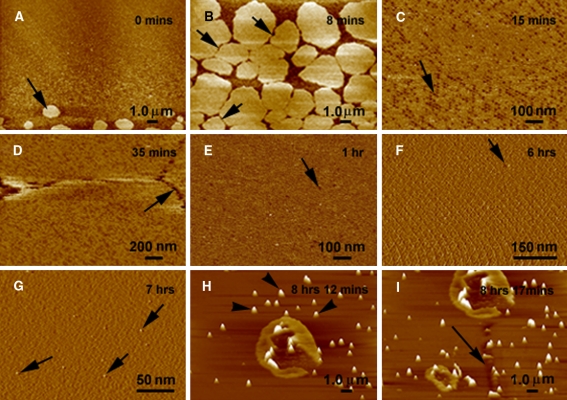
Cell and molecular imaging has a long and distinguished history. Erythrocytes were visualized microscopically by van Leeuwenhoek in 1674, and microscope technology has evolved mightily since the first single-lens instruments, and now incorporates many types that do not use photons of light for image formation. The combination of these instruments with preparations stained with histochemical and immunohistochemical markers has revolutionized imaging by allowing the biochemical identification of components at subcellular resolution. The field of cardiovascular disease has benefited greatly from these advances for the characterization of disease etiologies. In this review, we will highlight and summarize the use of microscopy imaging systems, including light microscopy, electron microscopy, confocal scanning laser microscopy, laser scanning cytometry, laser microdissection, and atomic force microscopy in conjunction with a variety of histochemical techniques in studies aimed at understanding mechanisms underlying cardiovascular diseases at the cell and molecular level.


Figures

Fig. 1
Fig. 1
Demonstration of staining used to analyze the composition of atherosclerotic lesions in the aortas of C57Bl6 and ApoE knockout mice. a Oil red O staining of a section of aorta from a 20-week-old male C57Bl6 mouse shows essentially no lipid-containing lesion. Images from the aortas of 20-week-old female ApoE knockout mice stained with oil red O to demonstrate lipid (b), SYTOX Green to stain nuclei as an indicator of cellularity (c), and Picrosirius red as to detect collagen (d). Image “C” was created by digitally stitching vessel segments together to represent an entire aorta in cross-section. Transmitted light brightfield microscopy (a, b), epi-fluorescence microscopy (c), and polarized light microscopy (d). The images were cropped and processed in Adobe PhotoShop to remove extraneous tissue to highlight the aorta. From Wadsworth et al. 2002
Fig. 2
Fig. 2
Illustration of the difference in atherosclerotic lesion cellularity between a 20 week-old ApoE−/− mouse (a) and a 20 week-old ApoE−/− PAI-1+ mouse (b). Cryostat sections were stained with DAPI and viewed by conventional wide-field fluorescence microscopy using a 10× objective lens. Captured images were digitally stitched together and cropped to display the complete segment of aorta. Note the areas in “B” devoid of cellularity (arrows). c Results of qualitative and quantitative evaluation of lesion cellularity demonstrating the decreased lesion cellularity of ApoE−/− PAI-1+ animals compared with ApoE−/− animals. Scale bar 100 μm. c From Schneider et al. 2004
Fig. 3
Fig. 3
Paraffin section of aorta from an 18 week-old male ApoE−/− mouse fed a high fat diet and stained with DAPI (blue) to label nuclei, rat anti-mouse Mac-2 (green) for macrophages, mouse anti-α-smooth muscle actin clone 1A4 (red) and rabbit anti-collagen type III (yellow). The section was imaged on a Zeiss LSM510 META confocal scanning laser microscope. A Z-series was collected with a ×40 (NA 1.4) objective lens and projected. Scale bar 50 µm
Fig. 4
Fig. 4
Transmission electron micrograph of thin section from mouse myocardium subjected to 4 h of left coronary artery ligation, followed by 24 h of reperfusion. Note the general ischemic appearance of the tissue: disrupted nucleus (N), cytoplasmic vacancies (asterisks), and electron dense deposits (arrows) in the mitochondria
Fig. 5
Fig. 5
Temporal sequential effects of plasma protein β2GPI and aPL mAb IS3 on annexin A5 crystal structure. AFM images from a dynamic fluid tapping mode imaging experiment showing the effect of IS3 (h and i) on a pre-formed annexin A5 crystalline lattice (ag). Images (a–f) demonstrate the dynamic formation of an annexin A5 (40 μg/ml) 2-D crystal lattice on a planar phospholipid model membrane on muscovite mica. a At approximately one hour after adding annexin A5, (time zero) a ‘pebbled’ surface, indicating a primary conformational surface reaction, and forming annexin A5 crystal (arrow) lattice are seen. b Appearance of large and small irregular furrows (arrows) between coalescing annexin A5 lattices. Higher magnification (c) shows vacancies (arrow; small black holes) indicating incomplete 2D annexin A5 crystal lattice formation. Image (d) shows further diminution of vacancies and closing of furrows (arrow). Continual imaging (e and f) showing very few vacancies (arrow) remaining. Image (g) shows elevated nodules (arrows), presumably β2GPI aggregates. The addition (at 40 min) of β2GPI (15 μg/ml) alone has no discernible effect on the integrity of the preformed crystalline lattice as observed at higher magnifications using height (e) and amplitude (f and g) imaging. On the subsequent addition (at 6 h 40 min) of mAb IS3 (80 μg/ml), elevated globular structures, presumably antibody–antigen complexes (arrowheads) and circular deformities appeared, indicating intercalation, disruption and initial disintegration of the annexin A5 crystal lattice as seen in images (h) and (i). In image (i) an x, y offset shows further extent of early stage reaction including furrow (elongated arrow) reappearance. Height images (ae, h and i) processed with third order flatten and erase scan line. Amplitude images (f, g) processed with 1× convolution. Original magnifications: 20 μm × 20 μm scan (a, b, h, i); 2 μm (d); 1 μm (c, d); 500 nm (f, g). Displayed image (g) is a zoomed image of 250 nm × 250 nm. All images are 3D view with 45° pitch and zero rotation

References

    1. Abbate A, De Falco M, Morales C, Gelpi R, Prisco M, De Luca A, Palleiro J, Fedele V, Feroce F, Baldi F, Vetrovec GW, Baldi A (2007) Electron microscopy characterization of cardiomyocyte apoptosis in ischemic heart disease. Int J Cardiol 114:118–120 - DOI - PubMed
    1. Addison W (1841–1842) On the colourless corpuscles and on the molecules and cytoblasts in the blood. Lond Med Gaz NS 30:144–148
    1. Betzig E, Patterson GH, Sougrat R, Lindwasser OW, Olenych S, Bonifacino JS, Davidson MW, Lippincott-Schwartz J, Hess HF (2006) Imaging intracellular fluorescent proteins at nanometer resolution. Science 313:1642–1645 - DOI - PubMed
    1. Binbrek AS, Mittal B, Rao KNS, Sobel BE (2007) The potential of erythropoietin for conferring cardioprotection complementing reperfusion. Coron Artery Dis 18:583–585 - PubMed
    1. Binnig G, Quate CF, Gerber C (1986) Atomic force microscope. Phys Rev Lett 56:930–933 - DOI - PubMed

LinkOut - more resources