. 2008 Aug 15;72(3):1048-65.
doi: 10.1002/prot.22118.

Predicting helix orientation for coiled-coil dimers

Affiliations

Predicting helix orientation for coiled-coil dimers

James R Apgar et al. Proteins. .

Abstract

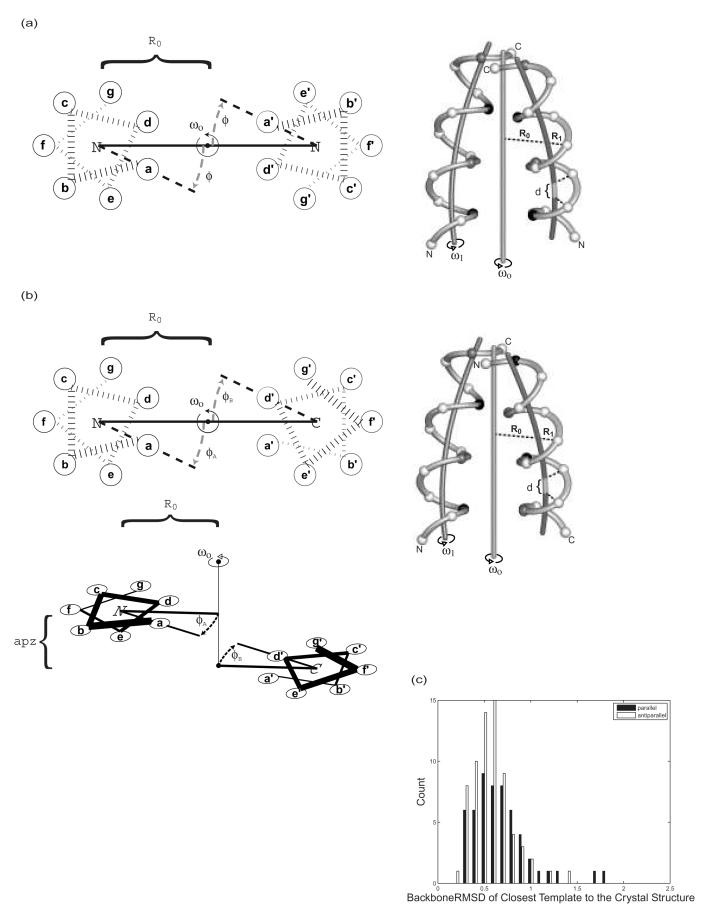
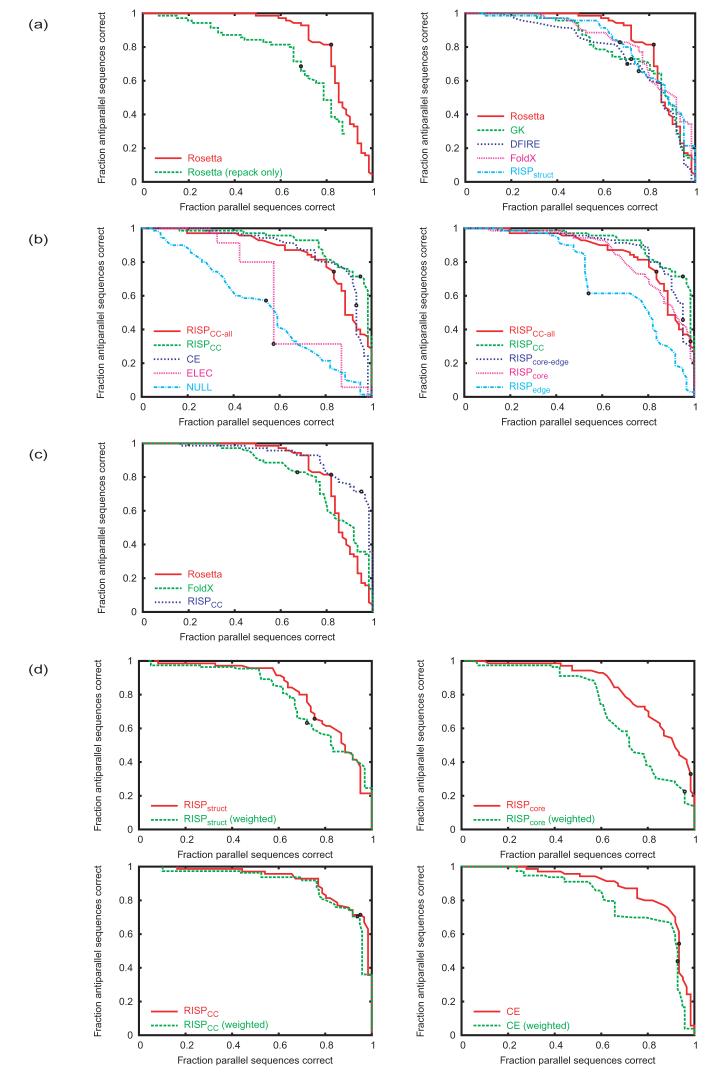
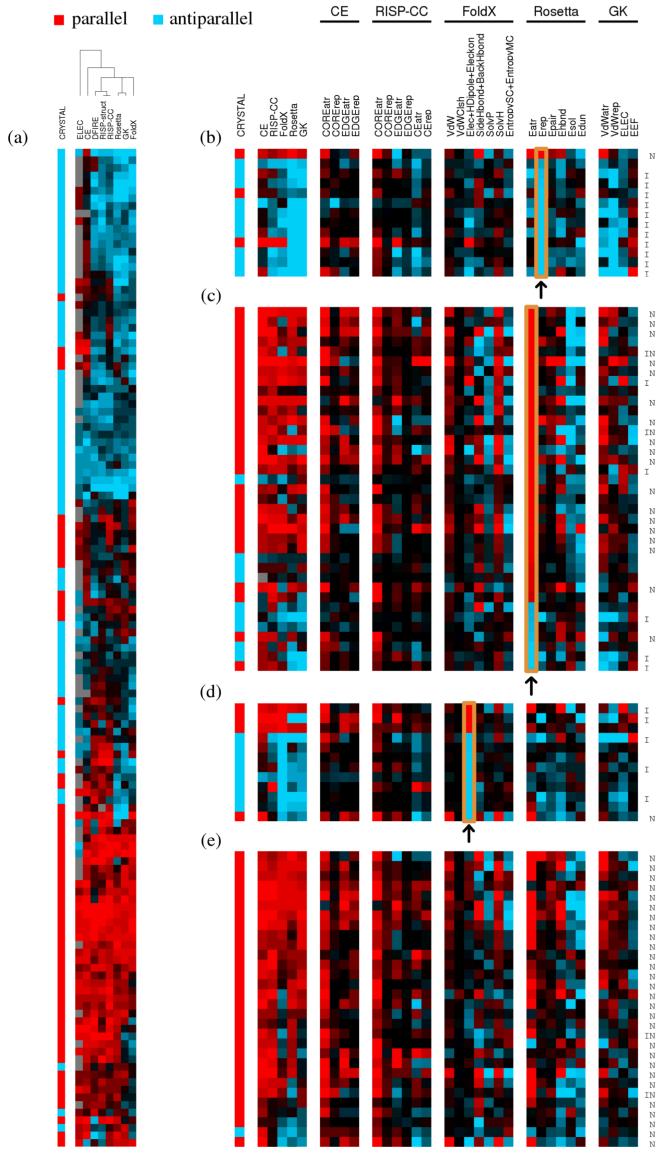
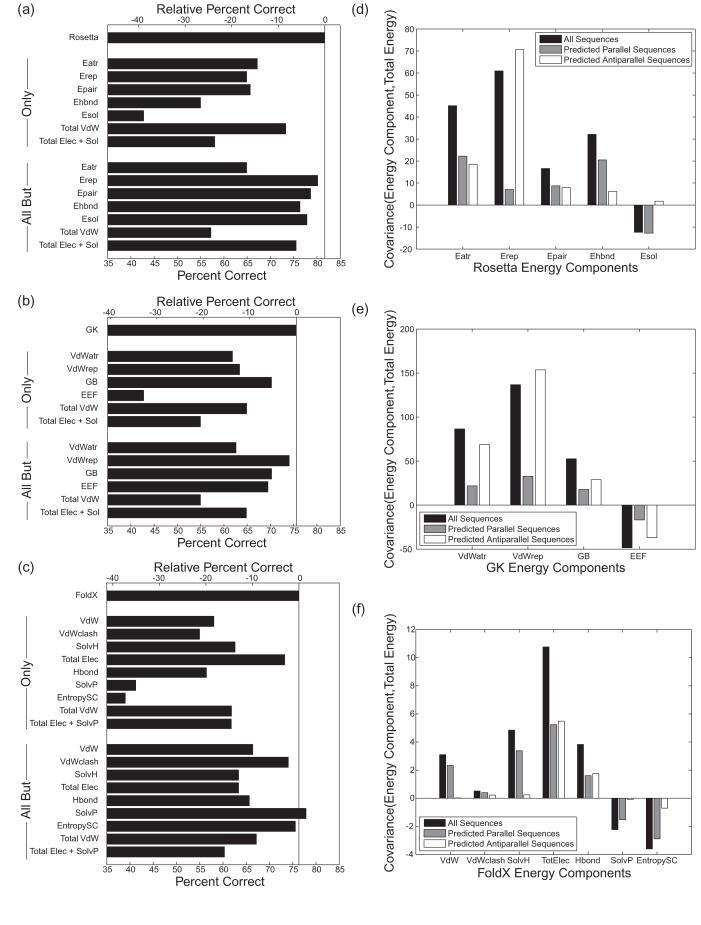
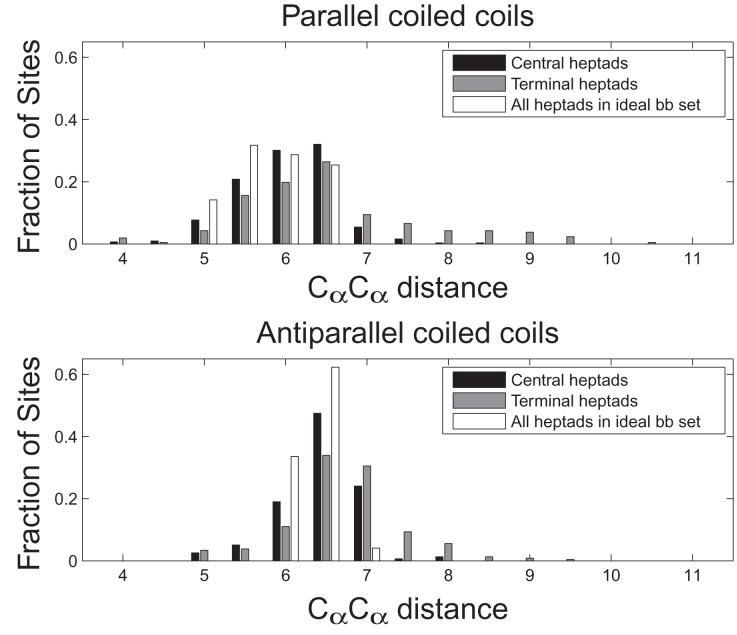
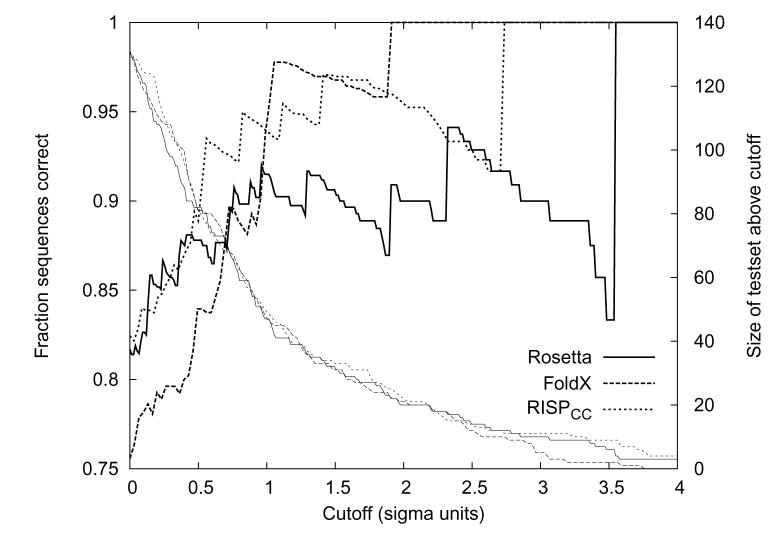
The alpha-helical coiled coil is a structurally simple protein oligomerization or interaction motif consisting of two or more alpha helices twisted into a supercoiled bundle. Coiled coils can differ in their stoichiometry, helix orientation, and axial alignment. Because of the near degeneracy of many of these variants, coiled coils pose a challenge to fold recognition methods for structure prediction. Whereas distinctions between some protein folds can be discriminated on the basis of hydrophobic/polar patterning or secondary structure propensities, the sequence differences that encode important details of coiled-coil structure can be subtle. This is emblematic of a larger problem in the field of protein structure and interaction prediction: that of establishing specificity between closely similar structures. We tested the behavior of different computational models on the problem of recognizing the correct orientation--parallel vs. antiparallel--of pairs of alpha helices that can form a dimeric coiled coil. For each of 131 examples of known structure, we constructed a large number of both parallel and antiparallel structural models and used these to assess the ability of five energy functions to recognize the correct fold. We also developed and tested three sequence-based approaches that make use of varying degrees of implicit structural information. The best structural methods performed similarly to the best sequence methods, correctly categorizing approximately 81% of dimers. Steric compatibility with the fold was important for some coiled coils we investigated. For many examples, the correct orientation was determined by smaller energy differences between parallel and antiparallel structures distributed over many residues and energy components. Prediction methods that used structure but incorporated varying approximations and assumptions showed quite different behaviors when used to investigate energetic contributions to orientation preference. Sequence based methods were sensitive to the choice of residue-pair interactions scored.


Figures

Figure 1
Figure 1
Crick parameterization of parallel and antiparallel coiled coils. (a-b) Schematic illustrating parameters used to describe (a) parallel and (b) antiparallel backbone geometries. For each wheel diagram, the heptad positions are indicated in lowercase letters and the direction of the chain is indicated by whether the N or C terminus is out of the page. For the structural diagram, the a and a’ positions are shown in black, the d and d’ positions in gray, and the rest in white. (c) Distribution of the backbone RMSD (N, Cα, and C atoms) for the native crystal structures in the test set to the closest ideal structure in the backbone sets. For every example, an idealized model with an RMSD of less than 1.8 Å was available for selection as a template.
Figure 2
Figure 2
Parallel vs. antiparallel discrimination performance of different methods. The fraction of antiparallel structures correctly predicted is plotted versus the fraction of parallel structures correctly predicted. Curves were generated by varying Ecut = EAP - EP. A structure was predicted to have an antiparallel orientation if the energy of the antiparallel state was lower than that of the parallel state plus Ecut. If this energy was higher, the orientation was predicted as parallel. Ecut = 0 denoted by black dot. (a) Comparison of ESMs. At left, a comparison of Rosetta evaluated on structures without (repacked only) or with (repacked, min) structural relaxation. At right, all candidate ESMs evaluated using relaxed structures. (b) Comparison of ISMs. At left, candidate ISMs including NULL control; at right, several variants of the RISP model. (c) Comparison of best ESM and ISM models. (d) Comparison of the performance on the test set (red) and the performance when hetero- and homodimer results are weighted equally (green). Clockwise from top left, the panels are for RISPstuct, RISPcore, CE and RISPCC.
Figure 3
Figure 3
Overview of prediction performance and component analysis. All predictions were made using Ecut = 0.(a) Predictions clustered by method and example. Color (red: parallel, blue: antiparallel) denotes orientation prediction, and intensity (bright to dark) corresponds to the score of that prediction (ΔE), binned into deciles, where darker color indicates low rank (ΔE close to zero). CRYSTAL column denotes orientation in the x-ray structure. (b-e) Prediction results for subsets of sequences, re-clustered. Color scheme as in (a). CRYSTAL column denotes known orientation. Remaining columns are energy terms contributing to overall orientation predictions for the best ESM and ISM methods. Terms favoring parallel orientation are red; those favoring antiparallel are blue. Intensity is in units of sigma (standard deviation of all energy components on all test sequences for a given prediction method), capped at 2.5 σ. In (b-e), energy terms are shown for examples with: (b) the largest absolute magnitude Rosetta Erep, (c) the largest absolute magnitude Rosetta Eatr, (d) the largest FoldX electrostatic components, and (e) paired a-a’ Asn residues in the parallel orientation. N indicates that the sequence pair contains Asn at one or more a-a’ positions in the parallel orientation; I indicates that the sequence pair contains an Ile pair at d-d’ in the parallel orientation. FoldX, Rosetta, and GK energy components are described further in the Methods and in Supplemental Table S3.
Figure 4
Figure 4
Energy component contributions to performance. (a-c) The performance of each component or sum of components was considered alone (Only) or was excluded from the total (All But). The lower axis shows absolute performance and the upper axis shows performance relative to the total energy. (a) Rosetta components as described in the methods with Total VdW including Eatr + Eref, and Total Elec + Sol including Epair + Esol. (b) GK energy components as described in the methods with Total VdW including VdWatr + VdWrep, and Total Elec + Sol including GB + EEF. (c) FoldX energy components as described in the methods with Total Elec including Elec + HDipole + Eleckon, Hbond including SideHbond + BackHBond, Total VdW including VdW + VdWclash and Total Elec + SolvP including Elec + HDipole + Eleckon + SolvP. (d-f) Histograms illustrating how different components of the energy functions co-vary with the overall predicted Eparallel - Eantiparallel values. Only energy terms with strong covariances are shown. Covariance for all sequences is shown in black, for sequences predicted to be parallel in gray, and for sequences predicted to be antiparallel in white. (d) Rosetta components are the same as in (a). (e) GK energy components are the same as in (b). (f) FoldX energy components are the same as in (c) with TotElec the same as Total Elec.
Figure 5
Figure 5
Distribution of Cα-Cα distances for core residues in parallel and antiparallel coiled coils. All Cα-Cα distances between core residues (a-a’, d-d’ in parallel and a-d’ in antiparallel) were binned by distance. For the test-set structures, residues were divided into two sets: Central heptads (black) include positions that are not the first or last seven residues of a coiled-coil helix, and terminal heptads (gray) include residues that are the first or last seven in a coiled-coil helix. All core positions of the ideal backbone set are binned together and shown in white.
Figure 6
Figure 6
Performance as a function of increasing the gap requirement. Performance was evaluated only for those examples with ǀEparallel - Eantiparallelǀ > x*σ and is plotted (thick lines, left axis) as a function of x. The size of the test set at each value of x is plotted using thin lines and the right axis.

References

    1. Berger B, Wilson DB, Wolf E, Tonchev T, Milla M, Kim PS. Predicting coiled coils by use of pairwise residue correlations. Proc Natl Acad Sci USA. 1995;92(18):8259–8263. - PMC - PubMed
    1. Delorenzi M, Speed T. An HMM model for coiled-coil domains and a comparison with PSSM-based predictions. Bioinformatics. 2002;18(4):617–625. - PubMed
    1. McDonnell AV, Jiang T, Keating AE, Berger B. Paircoil2: improved prediction of coiled coils from sequence. Bioinformatics. 2006;22(3):356–358. - PubMed
    1. Wolf E, Kim PS, Berger B. MultiCoil: a program for predicting two- and three-stranded coiled coils. Protein Sci. 1997;6(6):1179–1189. - PMC - PubMed
    1. Woolfson DN, Alber T. Predicting oligomerization states of coiled coils. Protein Sci. 1995;4(8):1596–1607. - PMC - PubMed

Publication types

Substances

LinkOut - more resources