

Association of prenatal and childhood blood lead concentrations with criminal arrests in early adulthood
- PMID: 18507497
- PMCID: PMC2689664
- DOI: 10.1371/journal.pmed.0050101
Association of prenatal and childhood blood lead concentrations with criminal arrests in early adulthood
Abstract
Background: Childhood lead exposure is a purported risk factor for antisocial behavior, but prior studies either relied on indirect measures of exposure or did not follow participants into adulthood to examine the relationship between lead exposure and criminal activity in young adults. The objective of this study was to determine if prenatal and childhood blood lead concentrations are associated with arrests for criminal offenses.
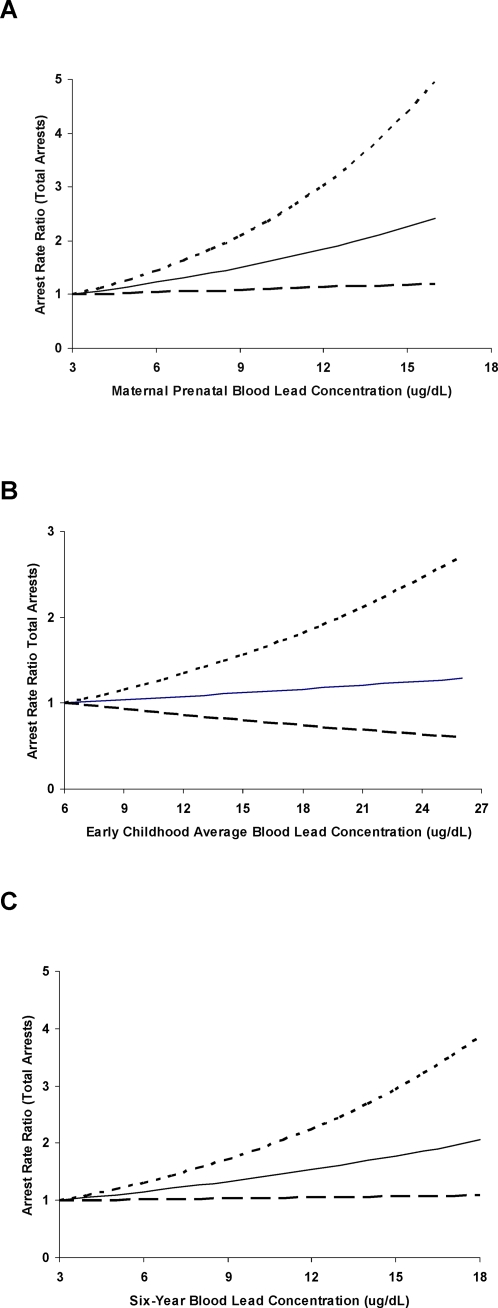
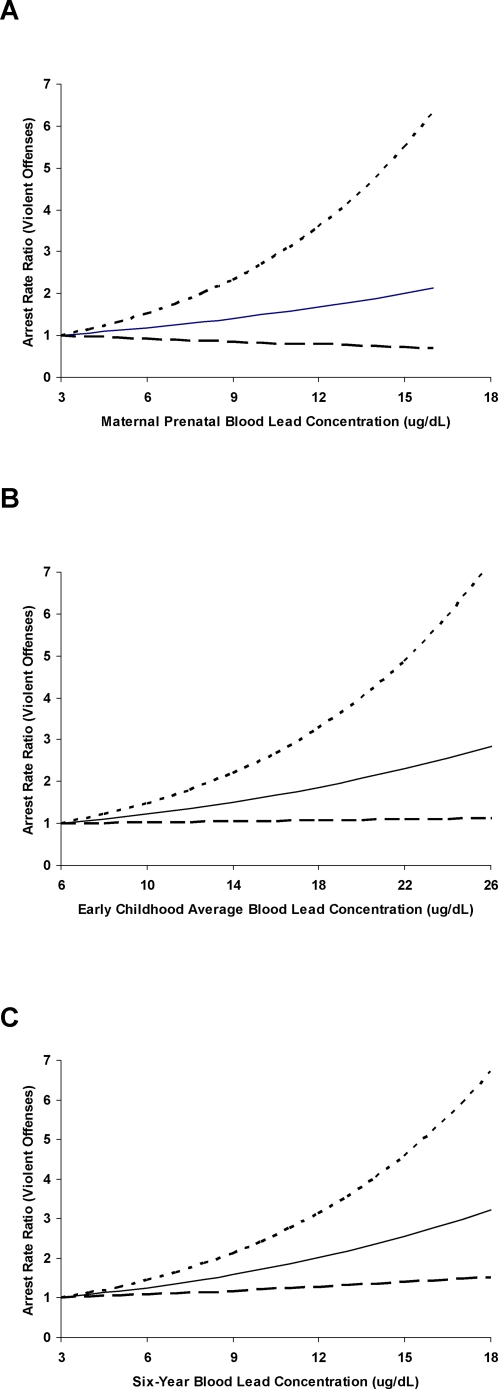
Methods and findings: Pregnant women were recruited from four prenatal clinics in Cincinnati, Ohio if they resided in areas of the city with a high concentration of older, lead-contaminated housing. We studied 250 individuals, 19 to 24 y of age, out of 376 children who were recruited at birth between 1979 and 1984. Prenatal maternal blood lead concentrations were measured during the first or early second trimester of pregnancy. Childhood blood lead concentrations were measured on a quarterly and biannual basis through 6.5 y. Study participants were examined at an inner-city pediatric clinic and the Cincinnati Children's Hospital Medical Center in Cincinnati, Ohio. Total arrests and arrests for offenses involving violence were collected from official Hamilton County, Ohio criminal justice records. Main outcomes were the covariate-adjusted rate ratios (RR) for total arrests and arrests for violent crimes associated with each 5 microg/dl (0.24 micromol/l) increase in blood lead concentration. Adjusted total arrest rates were greater for each 5 microg/dl (0.24 micromol/l) increase in blood lead concentration: RR = 1.40 (95% confidence interval [CI] 1.07-1.85) for prenatal blood lead, 1.07 (95% CI 0.88-1.29) for average childhood blood lead, and 1.27 (95% CI 1.03-1.57) for 6-year blood lead. Adjusted arrest rates for violent crimes were also greater for each 5 microg/dl increase in blood lead: RR = 1.34 (95% CI 0.88-2.03) for prenatal blood lead, 1.30 (95% CI 1.03-1.64) for average childhood blood lead, and 1.48 (95% CI 1.15-1.89) for 6-year blood lead.
Conclusions: Prenatal and postnatal blood lead concentrations are associated with higher rates of total arrests and/or arrests for offenses involving violence. This is the first prospective study to demonstrate an association between developmental exposure to lead and adult criminal behavior.
Conflict of interest statement
Figures
Comment in
-
Neurological and behavioral consequences of childhood lead exposure.PLoS Med. 2008 May 27;5(5):e115. doi: 10.1371/journal.pmed.0050115. PLoS Med. 2008. PMID: 18507501 Free PMC article.
References
-
- Farrington DP. Stepping stones to adult criminal careers. In: Olweus D, Block J, Radke-Yarrow M, editors. Development of Antisocial and Prosocial Behavior. New York: Academic Press; 1986. pp. 359–384.
-
- Farrington DP. Childhood aggression and adult violence: Early precursors and later-life outcomes. In: Pepler DJ, Rubin KH, editors. The Development and Treatment of Childhood Aggression. Hillsdale (New Jersey): Lawrence Erlbaum; 1991. pp. 5–29.
-
- Nagin DS, Farrington DP. The stability of criminal potential from childhood to adulthood. Criminology. 1992;30:235–260.
-
- Lipsy MW, Derzon JH. Predictors of violent or serious delinquency in adolescence and early adulthood: a synthesis of longitudinal research. In: Loeber R, Farrington DP, editors. Serious and Violent Juvenile Offenders: Risk Factors and Successful Interventions. Thousand Oaks (California): Sage Publications; 1998. pp. 86–105.
-
- Denno D. Biology and Violence. New York: Cambridge University Press; 1990.
Publication types
MeSH terms
Substances
Grants and funding
LinkOut - more resources
Full Text Sources
Medical
