. 2008;9(5):R90.
doi: 10.1186/gb-2008-9-5-r90. Epub 2008 May 28.

Unraveling the genomic mosaic of a ubiquitous genus of marine cyanobacteria

Affiliations

Unraveling the genomic mosaic of a ubiquitous genus of marine cyanobacteria

Alexis Dufresne et al. Genome Biol. 2008.

Abstract

Background: The picocyanobacterial genus Synechococcus occurs over wide oceanic expanses, having colonized most available niches in the photic zone. Large scale distribution patterns of the different Synechococcus clades (based on 16S rRNA gene markers) suggest the occurrence of two major lifestyles ('opportunists'/'specialists'), corresponding to two distinct broad habitats ('coastal'/'open ocean'). Yet, the genetic basis of niche partitioning is still poorly understood in this ecologically important group.

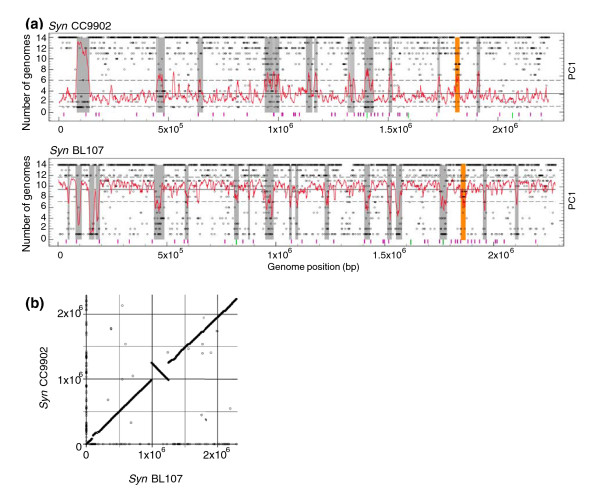
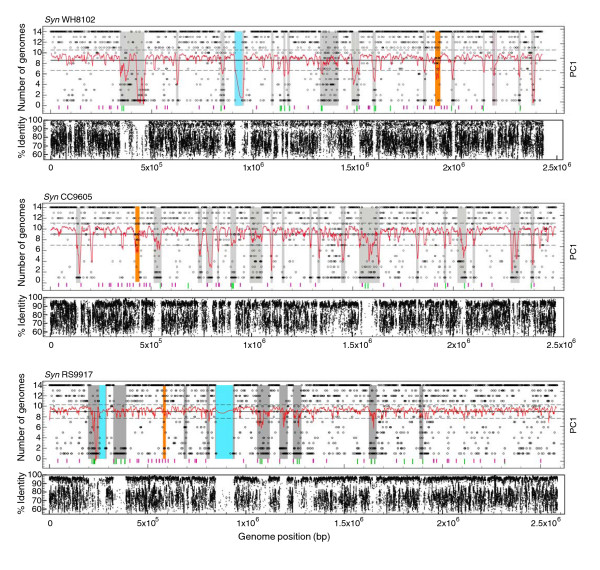
Results: Here, we compare the genomes of 11 marine Synechococcus isolates, representing 10 distinct lineages. Phylogenies inferred from the core genome allowed us to refine the taxonomic relationships between clades by revealing a clear dichotomy within the main subcluster, reminiscent of the two aforementioned lifestyles. Genome size is strongly correlated with the cumulative lengths of hypervariable regions (or 'islands'). One of these, encompassing most genes encoding the light-harvesting phycobilisome rod complexes, is involved in adaptation to changes in light quality and has clearly been transferred between members of different Synechococcus lineages. Furthermore, we observed that two strains (RS9917 and WH5701) that have similar pigmentation and physiology have an unusually high number of genes in common, given their phylogenetic distance.

Conclusion: We propose that while members of a given marine Synechococcus lineage may have the same broad geographical distribution, local niche occupancy is facilitated by lateral gene transfers, a process in which genomic islands play a key role as a repository for transferred genes. Our work also highlights the need for developing picocyanobacterial systematics based on genome-derived parameters combined with ecological and physiological data.


Figures

Figure 1
Figure 1
The core and accessory genomes of marine picocyanobacteria. (a) Number of genes distributed between the core and accessory components of each of the 11 Synechococcus and 3 Prochlorococcus genomes used in this study. The core genome common to all picocyanobacteria is indicated as green bars. The Synechococcus-specific core genome includes an additional set of genes shown as orange bars. The accessory genome is split between unique genes, indicated as white bars, and genes shared between 2-13 genomes, indicated as light grey bars. Note that when considering marine picocyanobacteria, genes shown in orange are part of the accessory genome. (b) Same as (a) but showing percentage of genes. (c) Number of unique genes relative to genome size. (d) Cumulative size of islands (red bars) and giant open reading frames (ORFs; white bars) relative to total genome size. (e) Same as (d) but showing percentage of base-pairs. (f) Cumulative length of islands versus size of Synechococcus genomes.
Figure 2
Figure 2
Genome plot of recently acquired genomic islands in Synechococcus spp. BL107 and CC9902 and whole genome alignment showing the positions of orthologous genes. (a) Genome plot with predicted islands highlighted in grey, except the phycobilisome gene cluster, which is highlighted in orange. The frequency with which a gene appears among the 14 genomes analyzed is represented by an open circle (that is, a core gene is present in 14 genomes). Deviation in tetranucleotide frequency is plotted in red as the first principal component in overlapping six gene intervals relative to the mean of the entire genome (black line) and standard deviation (broken black lines). The position of tRNA genes (purple bars) and mobility genes, such as those encoding phage integrases and transposases, are also indicated (green bars). (b) Whole genome alignment of Synechococcus BL107 and CC9902 showing the positions of orthologous genes.
Figure 3
Figure 3
Genome plots of recently acquired islands in Synechococcus spp. WH8102, CC9605 and RS9917 and recruitment plots of environmental DNA fragments sampled during the GOS expedition [56]. Predicted islands are highlighted in grey, except the phycobilisome gene cluster which is highlighted in orange, and the giant open reading frames which are highlighted in blue. The frequency with which a gene appears among the 14 genomes analyzed is represented by an open circle (that is, a core gene is present in 14 genomes). Deviation in tetranucleotide frequency is plotted in red as the first principal component in overlapping six gene intervals relative to the mean of the entire genome (black line) and standard deviation (broken black lines). The position of tRNA genes (purple bars) and mobility genes, such as those encoding phage integrases and transposases, are also indicated (green bars). Note the good match (in most cases) between the location of islands (mainly predicted by deviation of tetranucleotide frequency) and a dramatic decrease of the frequency of hits from natural samples. This observation clearly demonstrates the strong variability of the gene content of islands.
Figure 4
Figure 4
Phylogenetic relationships of marine Synechococcus and Prochlorococcus. (a) Unrooted distance tree based on concatenated alignments of 1,129 core proteins (307,756 amino acid positions) excluding families with paralogs. (b) 16S rRNA gene phylogeny constructed with NJ. Numbers at nodes indicate bootstrap values for distance, parsimony and ML trees, respectively.
Figure 5
Figure 5
Analyses of bipartition spectra for 12 genomes of marine picocyanobacteria. (a) Out of 2,037 bipartitions, 155 were found to be supported with 70% or higher bootstrap values. Percentage values indicate the proportion of gene families that support each consensus bipartition. Only nine consensus bipartitions were found with the Condense software. These bipartitions, represented by orange stars and numbered from 1 to 9, do not conflict with one another and can be combined in a single consensus tree that has the same topology as the tree of core proteins (Figure 4a) except for the position of Prochlorococcus sp. MIT9313. Some consensus bipartitions are supported by a low percentage of gene families. This is likely an effect of the rapid divergence between marine Synechococcus and Prochlorococcus leading to very small internal branches in phylogenetic trees. (b) Modified Lento plot for bipartitions with at least 70% bootstrap support. For each bipartition (numbered from 1 to 9), positive values on the y axis give the number of gene families that support the bipartition for a given bootstrap value (color coded). Negative values give the number of families that conflict with this bipartition. A given gene family can conflict with several bipartitions.
Figure 6
Figure 6
Relationships between genomes based on accessory gene content. (a) Phylogenetic network constructed using genes shared by 2-13 genomes with a ML distance estimator and represented as a neighbor net with bootstrap values as implemented by SplitsTree 4.8. (b) Number of occurrences of different genome pairs (indicated as 'x+y') among protein families containing only two genomes. Only those pairs including either WH5701 or RS9917 (or both) are shown, as well as the two most related genome pairs BL107/CC9902 and WH7803/WH7805, shown here for comparison.
Figure 7
Figure 7
Genome-wide ANI versus percentage of 16S rRNA gene identity. Note that because of the close relatedness between CC9902 and BL107, their respective ANI with any other Synechococcus strains are very similar, so only CC9902 is shown on the graph except when compared to BL107 itself.
Figure 8
Figure 8
Genome encoded regulatory capacity reflects general life strategies of marine picocyanobacteria. The number of response regulators (RR) and sensor histidine kinases (HK) of two-component regulatory systems, and cAMP-receptor protein (CRP) family regulators encoded in each genome are presented.

References

    1. Goericke R, Welschmeyer NA. The marine prochlorophyte Prochlorococcus contributes significantly to phytoplankton biomass and primary production in the Sargasso Sea. Deep-Sea Res. 1993;40:2283–2294. doi: 10.1016/0967-0637(93)90104-B. - DOI
    1. Li WKW. Primary productivity of prochlorophytes, cyanobacteria, and eucaryotic ultraphytoplankton: measurements from flow cytometric sorting. Limnol Oceanogr. 1994;39:169–175.
    1. Moran XAG, Fernandez E, Perez V. Size-fractionated primary production, bacterial production and net community production in subtropical and tropical domains of the oligotrophic NE Atlantic in autumn. Mar Ecol Prog Ser. 2004;274:17–29. doi: 10.3354/meps274017. - DOI
    1. Scanlan DJ, West NJ. Molecular ecology of the marine cyanobacterial genera Prochlorococcus and Synechococcus. FEMS Microbiol Ecol. 2002;40:1–12. doi: 10.1111/j.1574-6941.2002.tb00930.x. - DOI - PubMed
    1. Olson RJ, Zettler ER, Armbrust EV, Chisholm SW. Pigment, size and distribution of Synechococcus in the North Atlantic and Pacific oceans. Limnol Oceanogr. 1990;35:45–58.

Publication types

MeSH terms

LinkOut - more resources