. 2008 Aug;82(15):7700-10.
doi: 10.1128/JVI.00605-08. Epub 2008 May 28.

Induction of plasma (TRAIL), TNFR-2, Fas ligand, and plasma microparticles after human immunodeficiency virus type 1 (HIV-1) transmission: implications for HIV-1 vaccine design

Affiliations

Induction of plasma (TRAIL), TNFR-2, Fas ligand, and plasma microparticles after human immunodeficiency virus type 1 (HIV-1) transmission: implications for HIV-1 vaccine design

Nancy Gasper-Smith et al. J Virol. 2008 Aug.

Abstract

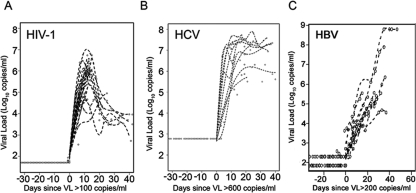
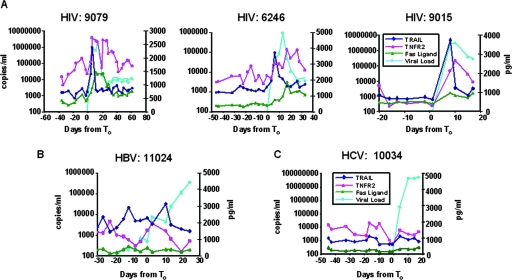
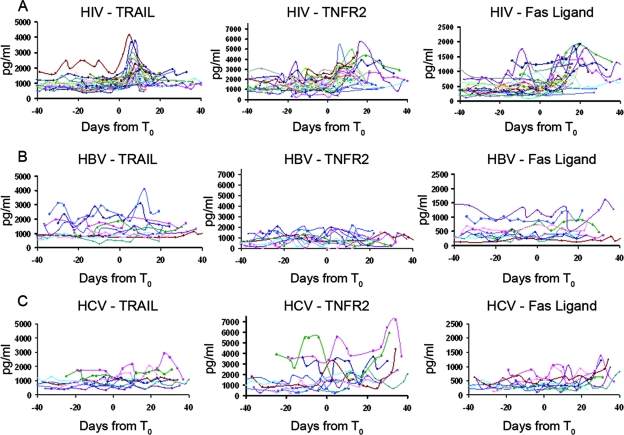
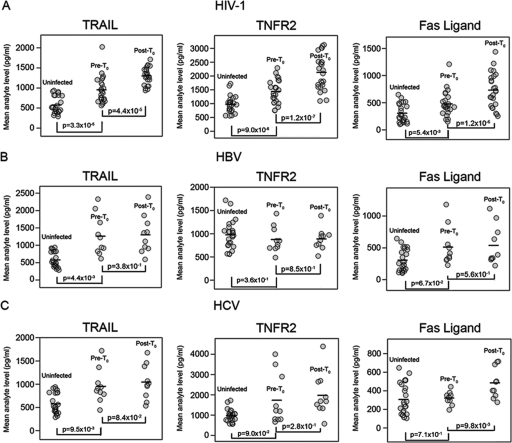
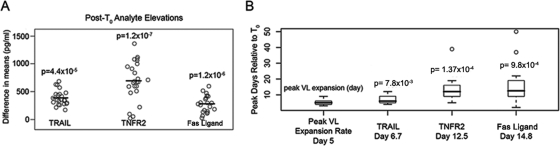
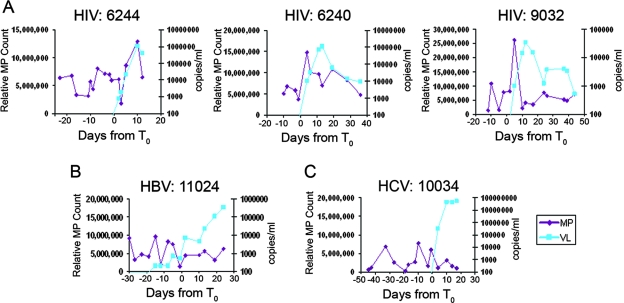
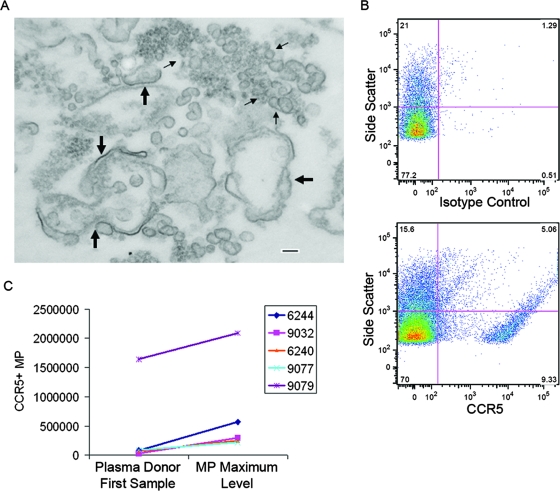
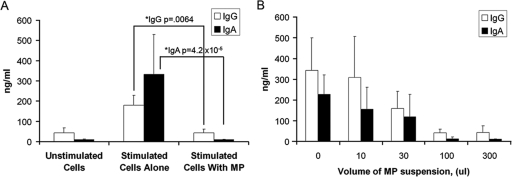
The death of CD4(+) CCR5(+) T cells is a hallmark of human immunodeficiency virus (HIV) infection. We studied the plasma levels of cell death mediators and products--tumor necrosis factor (TNF)-related apoptosis-inducing ligand (TRAIL), Fas ligand, TNF receptor type 2 (TNFR-2), and plasma microparticles--during the earliest stages of infection following HIV type 1 (HIV-1) transmission in plasma samples from U.S. plasma donors. Significant plasma TRAIL level elevations occurred a mean of 7.2 days before the peak of plasma viral load (VL), while TNFR-2, Fas ligand, and microparticle level elevations occurred concurrently with maximum VL. Microparticles had been previously shown to mediate immunosuppressive effects on T cells and macrophages. We found that T-cell apoptotic microparticles also potently suppressed in vitro immunoglobulin G (IgG) and IgA antibody production by memory B cells. Thus, release of TRAIL during the onset of plasma viremia (i.e., the eclipse phase) in HIV-1 transmission may initiate or amplify early HIV-1-induced cell death. The window of opportunity for a HIV-1 vaccine is from the time of HIV-1 transmission until establishment of the latently infected CD4(+) T cells. Release of products of cell death and subsequent immunosuppression following HIV-1 transmission could potentially narrow the window of opportunity during which a vaccine is able to extinguish HIV-1 infection and could place severe constraints on the amount of time available for the immune system to respond to the transmitted virus.


Figures

FIG. 1.
FIG. 1.
Plasma VLs of HIV-1-, HCV-, and HBV-infected plasma donor subjects. A total of 26 HIV-1+ seroconversion plasma donor plasma panels (HBV and HCV negative), 10 HBV plasma donor seroconversion panels (HIV-1 negative), and 10 HCV plasma donor seroconversion panels (HIV-1 negative) were studied. Panels demonstrate the kinetics of VL ramp-up in cases of HIV-1 (A), HCV (B), and HBV (C) infection. T0 was defined as the first day that the VL reached 100 copies/ml for HIV-1, 600 copies/ml for HCV, and 200 copies/ml for HBV. T0 values were assigned to only 26 out of 30 panels studied because of time gaps in sampling for four subjects.
FIG. 2.
FIG. 2.
Representative plasma donor patient samples analyzed for plasma markers of cell death. (A) TRAIL, TNFR-2, and Fas ligand levels were measured for each plasma sample by ELISA for three representative HIV-1+ subjects. Data for a representative patient with acute HBV are shown in panel B; data for a representative patient with acute HCV are shown in panel C. TRAIL levels are shown in dark blue, TNFR-2 levels in red, Fas ligand levels in green, and VL levels in light blue. Whereas elevations in TRAIL, TNFR-2, and Fas ligand levels were commonly found in samples from acutely HIV-1-infected plasma donors, they were not common in samples from HBV- and HCV-infected subjects (see Table S1 in the supplemental material).
FIG. 3.
FIG. 3.
Composite data showing TRAIL, TNFR-2, and Fas ligand levels for all subjects throughout the course of acute HIV-1 infection (30 subjects), acute HBV infection (10 subjects), and acute HCV infection (10 subjects). (A) Analyte data from acute HIV-1 infection results show early peaks in plasma TRAIL levels and later elevations in TNFR-2 and Fas ligand levels. (B and C) Only 3 of a total of 20 subjects with acute hepatitis infection (HBV and HCV) had elevations in TRAIL levels, and the late elevations in plasma analyte levels seen in cases of HIV-1 infection were not seen in cases of HBV infection for TNFR-2 or Fas ligand levels; however, elevations in TNFR-2 levels were seen for 6 subjects with acute HCV infection. Elevations were defined as >20% increases in plasma analyte levels within 15 days before or after the observed maximum VL (see Table S1 in the supplemental material).
FIG. 4.
FIG. 4.
Pre-T0 and mean post-T0 analyte levels for cohorts of subjects acutely infected with HIV-1, HBV, and HCV, with mean analyte levels compared to those of a cohort of 25 uninfected-control plasma samples. (A) Mean HIV-1 post-T0 analyte levels were significantly elevated compared to pre-T0 mean analyte levels from the same infected subjects; in addition, HIV pre-T0 levels were significantly elevated compared to mean analyte levels from uninfected donors (P values from paired Wilcoxon rank-sum tests). Panels B and C show pre-T0 and post-T0 mean analyte levels for HBV (B) and HCV (C). (B) In HBV results, whereas there was no difference between pre-T0 and post-T0 analyte levels, there was a significant difference in uninfected plasma versus pre-T0 TRAIL levels. (C) In HCV results, post-T0 Fas ligand levels were significantly elevated compared to pre-T0 levels; pre-T0 HCV TRAIL levels were also significantly elevated compared to uninfected plasma control levels.
FIG. 5.
FIG. 5.
Analysis of significance of post-T0 analyte versus pre-T0 analyte level elevations and timing of peak analyte results relative to maximum viral expansion. Panel A shows the post-T0 analyte means minus pre-T0 analyte means of the results obtained with samples from plasma donors with acute HIV-1 infection. These data complement the data shown in Fig. 4A and confirm that for samples of plasma from subjects with acute HIV-1 infection, post-T0 elevations in TRAIL, TNFR-2, and Fas ligand levels were all statistically significant. Panel B shows the timing of analyte peaks relative to maximum viral expansion rates and the first appearance of virus plasma (T0) (see Methods and Materials in the supplemental material). Results are from a paired Wilcoxon signed-rank test, and P values indicate that the two means (i.e., the mean times of the maximum VL expansion and means of each analyte elevation) are significantly different. The delay among analyte peak occurrences after T0 can be described in terms of a mean, a median, and an interquartile range. The arrival time for each analyte maximum is compared with the time of peak viral expansion relative to T0. A P value from the Wilcoxon test is shown above the analyte of interest. The significant P values in panel B indicate that the average day of peak analyte level was significantly different from the average day of peak or maximal rate of viral expansion. Also noted are mean times of peak VL expansion after T0 (day 5), mean peak level of TRAIL after T0 (day 6.7), mean peak level of TNRF2 after T0 (day 12.5), and mean peak level of Fas ligand after T0 (day 14.8). Open circles indicate outlier values.
FIG. 6.
FIG. 6.
Relative MP counts from plasma samples. (A) Relative MP counts were acquired for each sequential time point for each plasma donor subject (subject numbers above the panels). Data shown are from 3 subjects representing 30 subjects studied. Eighteen of 30 HIV-1 plasma donors had elevations of MP levels within 30 days of the VL maximum value, while 5 of 10 subjects with acute HCV infection and 2 of 10 subjects with acute HBV infection had elevations in MP levels (see Table S1 in the supplemental material). Panel A presents data representing the results obtained with three representative subjects with acute HIV-1 infection. MP data are shown in magenta, and VL data are shown in blue. Panels B and C show representative panels of the results obtained with acute HBV (B)- and HCV (C)-infected subjects with less prominent or no MP level elevations (see Table S1 in the supplemental material). In panels A, B, and C, MP counts are shown in red and VL levels are shown in blue.
FIG. 7.
FIG. 7.
Morphology and CCR5 expression of plasma MPs in cases of acute HIV-1 infection. Panel A shows an electron micrograph of plasma MPs purified from a subject (6244) with acute HIV-1 infection at the time of peak MP and VL levels (see Fig. 4A). The micrograph shows plasma MPs that were pelleted by ultracentrifugation and purified over a sucrose pad. Large arrows indicate double-membrane MPs 100 nm to 1 μm in size. Small arrows indicate particles 30 to 100 nm in size (exosomes). Bar, 100 nm. Panel B shows flow cytometry panels obtained by labeling plasma MPs with either an isotype control (upper panel) or an anti-CCR5 monoclonal antibody (lower panel). In this sample from the time of peak VL and MP levels, 13% of MPs were CCR5+. Panel C shows comparisons of the absolute numbers of CCR5+ MPs (percentages of CCR5+ MPs determined by phenotypic flow analyses multiplied by the relative MP count) from five different seroconversion panels for the first plasma sample and at the time of peak MP levels.
FIG. 8.
FIG. 8.
Peripheral-blood-derived MPs induce suppression of PWM/oCpG oligonucleotide-stimulated tonsil memory B-cell production. (A) Tonsil cells obtained from healthy donors were cultured alone or in the presence of PWM and oCpG with or without PBMC-derived MPs. The addition of 100 μl of purified PBMC-derived MPs induced reduced production of both total IgG and IgA. Data are representative of the results of five experiments and are presented as means ± SEMs. Panel B shows dose-dependent suppression of IgG production induced by increasing amounts of PBMC MPs. Data represent the means ± SEMs of the results of three separate experiments.

References

    1. Abel, K., D. M. Rocke, B. Chohan, L. Fritts, and C. J. Miller. 2005. Temporal and anatomic relationship between virus replication and cytokine gene expression after vaginal simian immunodeficiency virus infection. J. Virol. 7912164-12172. - PMC - PubMed
    1. Admyre, C., S. M. Johansson, K. R. Qazi, J. J. Filén, R. Lahesmaa, M. Norman, E. P. Neve, A. Scheynius, and S. Gabrielsson. 2007. Exosomes with immune modulatory features are present in human breast milk. J. Immunol. 1791969-1978. - PubMed
    1. Aukrust, P., N. B. Liabakk, F. Muller, E. Lien, T. Espevik, and S. S. Froland. 1994. Serum levels of tumor necrosis factor-alpha (TNF alpha) and soluble TNF receptors in human immunodeficiency virus type 1 infection—correlations to clinical, immunologic, and virologic parameters. J. Infect. Dis. 169420-424. - PubMed
    1. Aupeix, K., B. Hugel, T. Martin, P. Bischoff, H. Lill, J. L. Pasquali, and J. M. Freyssinet. 1997. The significance of shed membrane particles during programmed cell death in vitro, and in vivo, in HIV-1 infection. J. Clin. Investig. 991546-1554. - PMC - PubMed
    1. Badley, A. D., A. A. Pilon, A. Landay, and D. H. Lynch. 2000. Mechanisms of HIV-associated lymphocyte apoptosis. Blood 962951-2964. - PubMed

Publication types

Substances