. 2008 Jul;147(3):1143-57.
doi: 10.1104/pp.108.121996. Epub 2008 May 28.

The Arabidopsis BRAHMA chromatin-remodeling ATPase is involved in repression of seed maturation genes in leaves

Affiliations

The Arabidopsis BRAHMA chromatin-remodeling ATPase is involved in repression of seed maturation genes in leaves

Xurong Tang et al. Plant Physiol. 2008 Jul.

Abstract

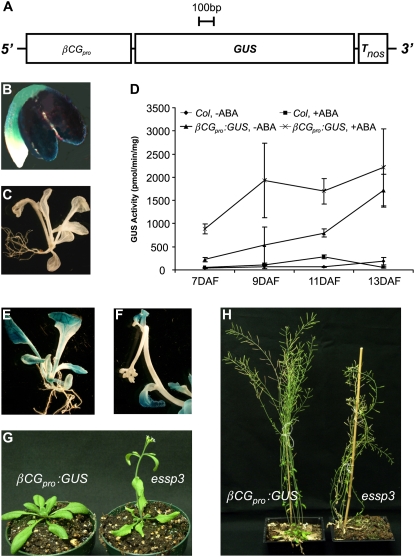
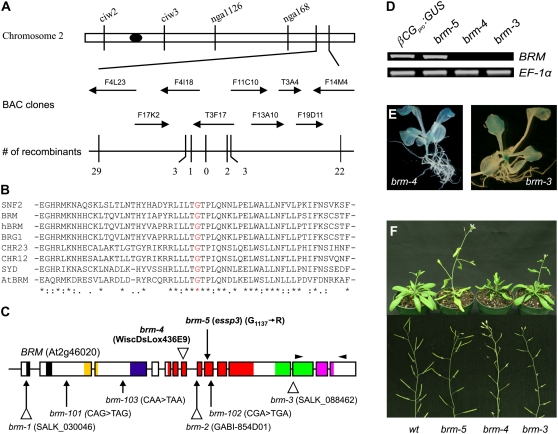
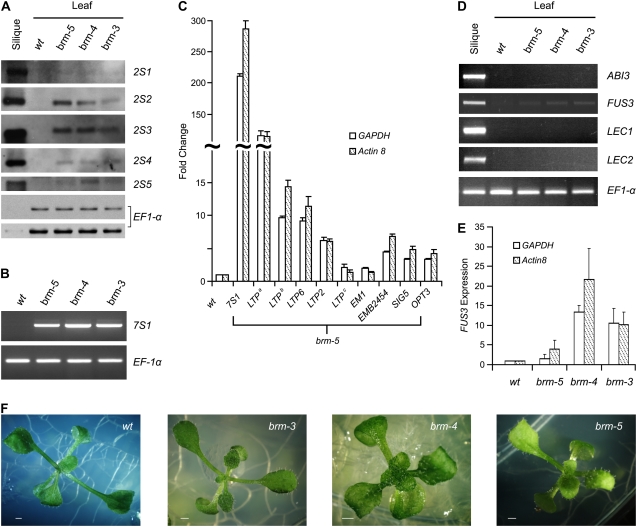
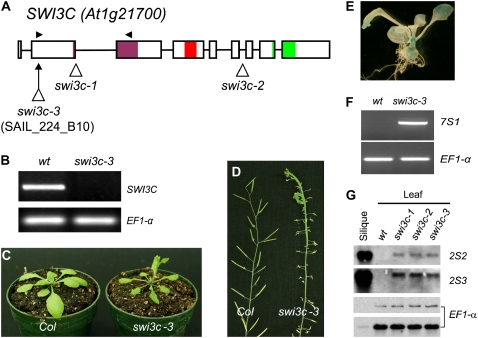
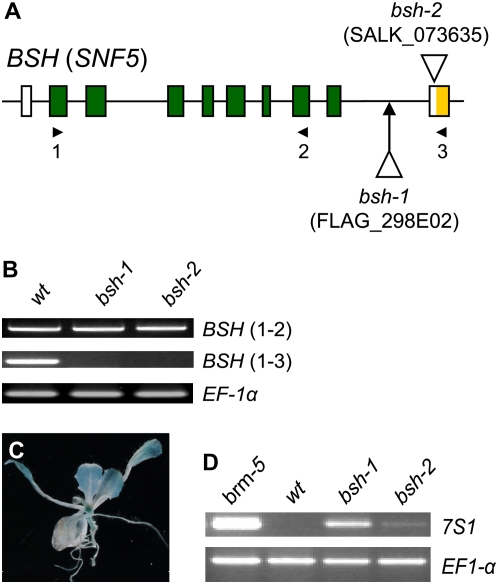
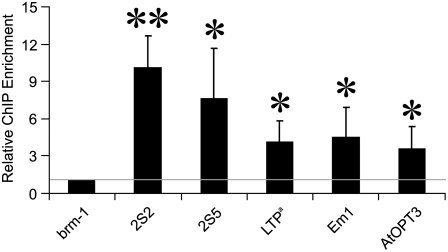
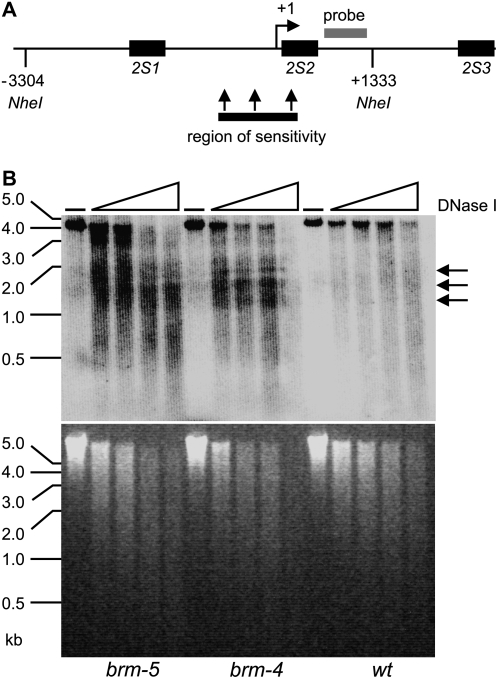
Synthesis and accumulation of seed storage proteins (SSPs) is an important aspect of the seed maturation program. Genes encoding SSPs are specifically and highly expressed in the seed during maturation. However, the mechanisms that repress the expression of these genes in leaf tissue are not well understood. To gain insight into the repression mechanisms, we performed a genetic screen for mutants that express SSPs in leaves. Here, we show that mutations affecting BRAHMA (BRM), a SNF2 chromatin-remodeling ATPase, cause ectopic expression of a subset of SSPs and other embryogenesis-related genes in leaf tissue. Consistent with the notion that such SNF2-like ATPases form protein complexes in vivo, we observed similar phenotypes for mutations of AtSWI3C, a BRM-interacting partner, and BSH, a SNF5 homolog and essential SWI/SNF subunit. Chromatin immunoprecipitation experiments show that BRM is recruited to the promoters of a number of embryogenesis genes in wild-type leaves, including the 2S genes, expressed in brm leaves. Consistent with its role in nucleosome remodeling, BRM appears to affect the chromatin structure of the At2S2 promoter. Thus, the BRM-containing chromatin-remodeling ATPase complex involved in many aspects of plant development mediates the repression of SSPs in leaf tissue.


Figures

Figure 1.
Figure 1.
Phenotypes of the essp3 mutant. A, Schematic representation of the βCGpro:GUS reporter gene construct. B and C, Histochemical analysis of GUS expression in a representative wild-type βCGpro:GUS transgenic embryo and a 14-d-old seedling grown on MS agar, respectively. D, Regulation of the βCGpro:GUS reporter gene by ABA. Staged immature siliques were harvested from βCGpro:GUS transgenic Arabidopsis plants, cultured on MS agar plates containing ABA (50 μm), and GUS activity was measured (picomoles/minutes/milligrams protein). DAF, Days after flowering. The mean and se were determined from three measurements. Bars represent ses. Siliques from wild-type (Col) Arabidopsis were used as control. E and F, GUS phenotype of the essp3 mutant. Shown is representative histochemical staining of GUS activity of a 14-d-old seedling and cauline leaves from a mature plant grown on MS agar media with 1.5% Suc, respectively. G and H, Morphological comparison of wild-type βCGpro:GUS and essp3 mutant plants at 3 weeks and 6 weeks, respectively.
Figure 2.
Figure 2.
Map-based cloning of essp3. A, Fine genetic mapping with PCR-based markers locate the essp3 locus to the bottom of chromosome 2, on BAC T3F17. The numbers of recombination events out of the total number of chromosomes examined (2,650) are indicated. B, Alignment of the deduced amino acid sequence of ESSP3/BRM with selected SNF2 homologs from yeast (SNF2), Drosophila (BRM), human (hBRM and BRG1), and three other members of the Arabidopsis SWI2/SNF2 subfamily (CHR12, CHR23, and SYD). Shown here is only the region flanking Gly-1,137 (highlighted in red) that is mutated to Arg in essp3. The asterisks indicate absolutely conserved residues; colons for high similarity; and dots for low similarity. C, Structure of the BRM gene and the location of mutation/T-DNA insertion sites of brm alleles. The two alleles (brm-4, brm-5) described in this work are depicted at the top and the six alleles documented previously are depicted at the bottom, including the three T-DNA alleles (brm-1–brm-3) characterized by Hurtado et al. (2006) and Farrona et al. (2007) and the three EMS alleles (brm-101–brm-103) identified by Kwon et al. (2006). Boxes indicate exons and lines represent introns and untranscribed regions. Protein domains of BRM are represented by colors: black, Gln-rich region; yellow, domain I; blue, domain II; red, ATPase domain; green, DNA-binding domains; pink, bromodomain. D, RT-PCR analysis of BRM expression in the three brm mutants and βCGpro:GUS. Primer locations are indicated by black arrowheads in C. Elongation factor 1α was used as internal control. E, GUS phenotype of a representative F2 progeny from the crosses of brm-4 × βCGpro:GUS and brm-3 × βCGpro:GUS, respectively. Plants were 2 weeks old and grown on MS agar plates. F, Morphological comparison of the brm mutants with wild-type plant at 4 weeks (top) and at maturity (bottom).
Figure 3.
Figure 3.
Validation of the DNA microarray results. A, RNA-blot analysis of the expression of the five 2S genes in leaves of the three brm mutants grown for 14 d on MS agar. Wild-type leaves and siliques were used as negative and positive controls, respectively. Same amount of RNA (5 μg for leaf samples and 200 ng for siliques) was used for each blot. Elongation factor 1α was used as loading control. B, RT-PCR analysis of At7S1 gene expression in the leaves of three brm mutants grown for 14 d on MS agar. C, Real-time qRT-PCR validation of the expression in brm-5 leaves of seed-related genes revealed in our DNA microarray analysis. RNAs from leaves of 14-d-old plants grown on MS agar were used for PCR. Only those validated by qRT-PCR are shown here. Wild-type (βCGpro:GUS) RNA levels are designated as 1-fold. The expression of GAPDH and Actin-8 was used as internal controls. The mean and se were determined from three biological replicates. Bars represent ses. Footnotes: a, At1g62500; b, At5g48490; c, At5g38160. D, RT-PCR analysis of the expression levels of the four positive regulators of maturation (ABI3, FUS3, LEC1, and LEC2) in brm mutant leaves of 14-d-old plants grown on MS agar. RNAs isolated from wild-type leaves and siliques were used as negative and positive controls, respectively. PCR cycle numbers: 32 for FUS3, 30 for EF1-α, and 38 for ABI3, LEC1, and LEC2. E, FUS3 expression in brm mutant leaves was monitored and quantified by qRT-PCR. RNAs from leaves of 14-d-old plants grown on MS agar were used for PCR. Wild-type (βCGpro:GUS) RNA levels are designated as 1-fold. The expression of GAPDH and Actin-8 was used as internal controls. The mean and se were determined from nine samples (three biological replicates and three real-time PCR reactions). Bars represent ses. F, Morphological comparison of 14-d-old wild type (βCGpro:GUS) and brm mutant plants grown on MS agar. Bar = 1 mm.
Figure 4.
Figure 4.
Analysis of an AtSWI3C null mutant. A, Structure of the AtSWI3C gene and T-DNA insertion sites. Protein domains are represented by colors: purple, SWIRM domain; red, SANT domain; green, Leu zipper domain. B, RT-PCR analysis of the SWI3C transcripts in swi3c-3 mutant leaves of 14-d-old plants grown on MS agar. Primers used are indicated in A by arrowheads. C, Morphology of the 3-week-old swi3c-3 mutant and wild-type plants. D, Siliques of swi3c-3 mutant and wild-type plants. E, GUS phenotype of a representative F2 progeny (grown for 14 d on MS agar) from the cross of βCGpro:GUS × swi3c-3. F, RT-PCR analysis of the At7S1 gene expression in leaves of 14-d-old swi3c-3 plants grown on MS agar. G, RNA-blot analysis of the expression of the two representative 2S genes, 2S2 and 2S3, in leaves of 14-d-old swi3c mutant plants grown on MS agar. Wild-type leaves and siliques were used as negative and positive controls, respectively. The same amount of RNA (5 μg for leaf samples and 200 ng for siliques) was used for each blot. Elongation factor 1α was used as loading control.
Figure 5.
Figure 5.
Analysis of BSH/SNF5 mutants. A, Structure of the BSH/SNF5 gene and T-DNA insertion sites of the mutants. Protein domains are represented by colors: green, SNF5 domain; yellow, Box B. B, RT-PCR analysis of BSH transcripts in leaves of 14-d-old bsh mutant plants grown on MS agar. Primers used are numbered and indicated in A. C, GUS phenotype of a representative F2 progeny (grown for 14 d on MS agar) from the cross of βCGpro:GUS × bsh-2. D, RT-PCR analysis of the At7S1 gene expression in leaves of 14-d-old bsh mutant plants grown on MS agar. The brm-5 sample was included for comparison.
Figure 6.
Figure 6.
Recruitment of BRM to promoters of selected embryogenesis genes. ChIP analysis with antibodies against BRM (α-BRM-N). Leaves from 14-d-old wild-type and brm-1 mutant plants grown on MS agar containing 1.5% Suc were analyzed with α-BRM-N. Promoter regions (within 700 bp upstream of the start codon) of the selected embryogenesis genes were analyzed by qPCR. Primer sequences are listed in Supplemental Table S3. Ta3 was also amplified as a control for repressed loci (Johnson et al., 2002). Relative ChIP enrichment values for the embryonic gene promoter regions in wild type (Col) were calculated relative to the enrichment value for corresponding promoter regions in brm-1 (see “Materials and Methods” for details). Value of ChIP enrichment in brm-1 was set to 1. The gray line indicates level of background precipitation in brm-1. Each value is the average of three independent biological replicates, each of which was conducted in triplicate. Bars indicate ses. ** and * denote ChIP enrichment values are significantly different at P < 0.01 and P < 0.05, respectively. Footnote a, At5g48490.
Figure 7.
Figure 7.
DNase I digestion profile of the At2S2 gene. A, A schematic representation showing restriction sites, probe, coding regions (black boxes), and the region of DNase I sensitivity. B, Top, Nuclei isolated from leaves of wild type (Col) and two brm mutant plants were digested with increasing concentrations of DNase I (at 0, 5, 10, 20, and 40 units/mL, for 3 min at 22°C). DNA was purified and then restricted with NheI before Southern blotting. The resulting membrane was probed with a fragment as indicated in A. Arrows indicate the sites of DNase I sensitivity. DNA size markers are indicated at left in kilobases. B, Bottom, Ethidium bromide staining of the gel.

References

    1. Aasland R, Gibson TJ, Stewart AF (1995) The PHD finger: implications for chromatin-mediated transcriptional regulation. Trends Biochem Sci 20 56–59 - PubMed
    1. Arondel V, Vergnolle C, Cantrel C, Kader JC (2000) Lipid transfer proteins are encoded by a small multigene family in Arabidopsis thaliana. Plant Sci 157 1–12 - PubMed
    1. Battaglioli E, Andrés ME, Rose DW, Chenoweth JG, Rosenfeld MG, Anderson ME, Mandel G (2002) REST repression of neuronal genes requires components of the hSWI.SNF complex. J Biol Chem 277 41038–41045 - PubMed
    1. Benjamini Y, Hochberg Y (1995) Controlling the false discovery rate-a practical and powerful approach to multiple testing. J Roy Statist Soc Ser B Methodological 57 289–300
    1. Bezhani S, Winter C, Hershman S, Wagner JD, Kennedy JF, Kwon CS, Pfluger J, Su Y, Wagner D (2007) Unique, shared, and redundant roles for the Arabidopsis SWI/SNF chromatin remodeling ATPases BRAHMA and SPLAYED. Plant Cell 19 403–416 - PMC - PubMed

Publication types

MeSH terms