. 2008 May 28;28(22):5696-709.
doi: 10.1523/JNEUROSCI.0009-08.2008.

Low-frequency local field potentials and spikes in primary visual cortex convey independent visual information

Affiliations

Low-frequency local field potentials and spikes in primary visual cortex convey independent visual information

Andrei Belitski et al. J Neurosci. .

Abstract

Local field potentials (LFPs) reflect subthreshold integrative processes that complement spike train measures. However, little is yet known about the differences between how LFPs and spikes encode rich naturalistic sensory stimuli. We addressed this question by recording LFPs and spikes from the primary visual cortex of anesthetized macaques while presenting a color movie. We then determined how the power of LFPs and spikes at different frequencies represents the visual features in the movie. We found that the most informative LFP frequency ranges were 1-8 and 60-100 Hz. LFPs in the range of 12-40 Hz carried little information about the stimulus, and may primarily reflect neuromodulatory inputs. Spike power was informative only at frequencies <12 Hz. We further quantified "signal correlations" (correlations in the trial-averaged power response to different stimuli) and "noise correlations" (trial-by-trial correlations in the fluctuations around the average) of LFPs and spikes recorded from the same electrode. We found positive signal correlation between high-gamma LFPs (60-100 Hz) and spikes, as well as strong positive signal correlation within high-gamma LFPs, suggesting that high-gamma LFPs and spikes are generated within the same network. LFPs <24 Hz shared strong positive noise correlations, indicating that they are influenced by a common source, such as a diffuse neuromodulatory input. LFPs <40 Hz showed very little signal and noise correlations with LFPs >40 Hz and with spikes, suggesting that low-frequency LFPs reflect neural processes that in natural conditions are fully decoupled from those giving rise to spikes and to high-gamma LFPs.


Figures

Figure 1.
Figure 1.
Illustration of the time course of the bandpassed LFP and of spiking activity during movie presentation, observed on a single electrode (animal D04, electrode 7). A, LFP traces (bandpassed in the 1–5 Hz frequency range) from five presentations of a 16-s-long movie extract. The traces were displaced on the vertical axis to make them distinguishable. B, The average over all trials of the time course of the instantaneous power of the 1–5 Hz LFP. The instantaneous power is normalized as a Z score (i.e., we subtracted the mean over the movie and divided by the SD over the movie of the instantaneous power). C, Time courses of the 28–32 Hz bandpassed LFP to the same five presentations of a 16-s-long movie extract as in A. D, The average over all trials of the time course of the instantaneous power of the 28–32 Hz LFP, with conventions as in B. E, Time courses of the 72–76 Hz bandpassed LFP to the same five presentations of a 16-s-long movie extract as in A. F, The average over all trials of the time course of the instantaneous power of the 72–76 Hz LFP, with conventions as in B. G, Raster plot of spike times (indicated by dots) resulting from repeated presentation of the selected 16 s movie extract. The five trials in A, C, and E correspond to the first five trials in G. H, Spike rate, averaged over all movie trials and computed in 4-ms-long sliding time bins, during the 16 s movie extract.
Figure 2.
Figure 2.
Spectral properties of LFPs and spikes during movie stimulation and spontaneous activity. All data from this figure were taken from the example channel (electrode 7, animal D04). A, The blue line plots the trial-averaged LFP spectrum over the entire movie presentation. The red line plots the average LFP spectrum during spontaneous activity. B, Trial-averaged spectrogram of the LFP (units of decibels) along the movie presentation. C, The blue line plots the trial-averaged spike spectrum over the entire movie presentation. The red line plots the average spike spectrum during spontaneous activity. D, Trial-averaged spectrogram of the spiking activity as a function of time during movie presentation (units of decibels).
Figure 3.
Figure 3.
Information about the movie stimulus carried by the power at different frequencies of LFPs and spikes. A, The information I(S; Rf) that the power of LFPs at frequency f conveys about the movie. B, The signal CV (solid line) and the noise CV (dashed line) of LFPs as function of frequency. C, The black solid line shows the information I(S; Rf) that the power of spikes at frequency f conveys about the movie. The dashed line is the spike power information corrected for the effect of the overall spike count on the spectrum (see text). The arrowhead points to the value of the information about the movie carried by spike counts. D, The signal CV (solid line) and the noise CV (dashed line) of spikes as function of frequency. In all panels, the lines report the mean over the entire dataset, and the gray area around it shows its SEM. SPK, Spike.
Figure 4.
Figure 4.
The information and the coefficient of variations carried by a pair of different LFP frequencies. A, The information about the movie I(S; Rf1Rf2) that can be extracted from two joint LFP frequencies f1 and f2. B, The two-dimensional signal CV quantifying the stimulus modulation of the trial-averaged power of two joint LFP frequencies f1 and f2. C, The two-dimensional noise CV quantifying the reliability across trials of the power of two joint LFP frequencies f1 and f2. Results in all panels reported the average over the entire dataset.
Figure 5.
Figure 5.
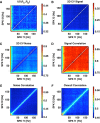
Correlations among pairs of different LFP frequencies. A, The signal correlation between the trial-averaged powers observed at two different LFP frequencies f1 and f2 during movie presentation. B, The noise correlation between the LFP powers at frequencies f1 and f2 during movie presentation. C, The overall correlation between the LFP power at frequencies f1 and f2 during movie presentation. D, The correlation between the LFP power at frequencies f1 and f2 during spontaneous activity. Results in all panels reported the average over the entire dataset.
Figure 6.
Figure 6.
Signal, noise, and overall correlations of the power across different LFP bands. A–I report data from an example electrode (no. 7, monkey d04nm1). A, D, and G illustrate the amount of signal correlation by showing scatter plots of the trial-averaged power response at different frequency pairs (12 vs 16, 72 vs 76, and 16 vs 72 Hz, respectively) in each 2.048-s-long window of the movie presentation. B, E, and H (again corresponding to 12 vs 16, 72 vs 76, and 16 vs 72 Hz, respectively) illustrate noise correlation by showing the scatterplot of the fluctuations (around the mean across trials in the same time window) of the power in each trial and window. C, F, and I illustrate the amount of overall correlation by showing the scatterplot of the power in each trial and window at two different frequency pairs (12 vs 16, 72 vs 76, and 16 vs 72 Hz, respectively). The insets in each panel report the r2 values of the linear fit of each scatterplot. For clarity of illustration, the power in each frequency has been normalized to 1 when summed over all windows and trials.
Figure 7.
Figure 7.
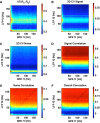
Information and correlations of pairs of different spike frequencies. A, The information about the movie I(S; Rf1Rf2) that can be extracted from two joint spike frequencies f1 and f2. B, The two-dimensional signal CV quantifying the stimulus modulation of the trial-averaged power of two joint spike frequencies f1 and f2. C, The two-dimensional noise CV quantifying the reliability across trials of the power of two joint spike frequencies f1 and f2. D, The signal correlation between the trial-averaged powers observed at two different spike frequencies f1 and f2. E, The noise correlation between the spike powers at frequencies f1 and f2. F, The overall correlation between the spike power at frequencies f1 and f2. Results in all panels report data collected during movie presentation and show the average over the entire dataset. SPK, Spike.
Figure 8.
Figure 8.
Information and correlations between LFP and spike frequencies. A, The information about the movie I(S; Rf1Rf2) that can be extracted from the joint observation of a spike frequency f1 and an LFP frequency f2. B, The two-dimensional signal CV quantifying the stimulus modulation of the trial-averaged power of a spike frequency f1 and an LFP frequency f2. C, The two-dimensional noise CV quantifying the reliability across trials of the power of a spike and an LFP frequency. D, The signal correlation between the trial-averaged powers of a spike and an LFP frequency. E, The noise correlation between a spike frequency f1 and an LFP frequency f2. F, The overall correlation between a spike and an LFP frequency. Results in all panels report data collected during movie presentation and show the average over the entire dataset. SPK, Spike.

References

    1. Andersen RA, Musallam S, Pesaran B. Selecting the signals for a brain-machine interface. Curr Opin Neurobiol. 2004;14:720–726. - PubMed
    1. Averbeck BB, Latham PE, Pouget A. Neural correlations, population coding and computation. Nat Rev Neurosci. 2006;7:358–366. - PubMed
    1. Bair W, Koch C, Newsome WT, Britten K. Power spectrum analysis of bursting cells in area MT in the behaving monkey. J Neurosci. 1994;14:2870–2892. - PMC - PubMed
    1. Basar E. Amsterdam, New York, Oxford: Elsevier/North Holland Biomedical; 1980. EEG-brain dynamics: relation between EEG and brain evoked potentials.
    1. Bedard C, Kroger H, Destexhe A. Model of low-pass filtering of local field potentials in brain tissue. Phys Rev E. 2006;73 051911. - PubMed

Publication types

LinkOut - more resources