. 2008 May 28;28(22):5846-60.
doi: 10.1523/JNEUROSCI.0835-08.2008.

The h channel mediates location dependence and plasticity of intrinsic phase response in rat hippocampal neurons

Affiliations

The h channel mediates location dependence and plasticity of intrinsic phase response in rat hippocampal neurons

Rishikesh Narayanan et al. J Neurosci. .

Abstract

The presence of phenomenological inductances in neuronal membrane has been known for more than one-half a century. Despite this, the dramatic contributions of such inductive elements to the amplitude and, especially, phase of neuronal impedance, and their roles in modulating temporal dynamics of neuronal responses have surprisingly remained unexplored. In this study, we demonstrate that the h channel contributes a location-dependent and plastic phenomenological inductive component to the input impedance of CA1 pyramidal neurons. Specifically, we show that the h channels introduce an apparent negative delay in the local voltage response of these neurons with respect to the injected current within the theta frequency range. The frequency range and the extent of this lead expand with increases in h current either through hyperpolarization, or with increasing distance of dendritic location from the soma. We also demonstrate that a spatially widespread increase in this inductive phase component accompanies long-term potentiation. Finally, using impedance analysis, we show that both location and activity dependence of intrinsic phase response are attributable not to changes in a capacitive or a leak component, but to changes in h-channel properties. Our results suggest that certain voltage-gated ion channels can differentially regulate internal time delays within neurons, thus providing them with an independent control mechanism in temporal coding of neuronal information. Our analyses and results also establish impedance as a powerful measure of intrinsic dynamics and excitability, given that it quantifies temporal relationships among signals and excitability as functions of input frequency.


Figures

Figure 1.
Figure 1.
A, RCL circuit with a leaky inductor. The leak component of the inductor is represented as a resistance in series, RL. The values of parameters used for plots in B and C were R = 10 GΩ, C = 90 pF, and RL = 100 MΩ. B, Impedance amplitude profiles for various values of L. For nonzero values of L, the circuit acts as a bandpass filter, and its resonance frequency increases with reduction in L. C, Impedance phase profile for various values of L. For nonzero values of L, the impedance phase is positive up to a certain crossover frequency, after which it turns negative. It may be noted that the peak positive phase value decreases with reduction in L. See supplemental Figure 1 (available at www.jneurosci.org as supplemental material) for the impedance amplitude and phase profiles of a RCL circuit with an ideal inductor. Plots in B and C were obtained from analytical expressions for impedance amplitude and phase of the circuit in A.
Figure 2.
Figure 2.
Simulations suggest that the h channel contributes an inductive component to neuronal input impedance. A, RCh circuit representing a single compartment neuron model, with the h conductance as the only active mechanism. Rm and Cm represent specific membrane resisitivity and specific membrane capacitance, respectively; h is the maximal h conductance and s(V,t) is the state variable that models the voltage dependence and kinetics of the h conductance. B, Chirp25 current stimulus (top) and a typical voltage response (bottom) of the model in A. C, Impedance amplitude profiles of the RC circuit (with h = 0 in A), the Rh circuit (with Cm = 0 in A), and the RCh circuit display low-pass, high-pass, and bandpass characteristics, respectively. For Rh and RCh plots, h = 200 μS/cm2. D, Impedance amplitude profiles of the RCh circuit obtained with various values of h. Note that the peak impedance amplitude decreases and the frequency at which this peak occurs (the resonance frequency) increases with increase in h. E, Impedance phase profiles of the Rh circuit, the RC circuit, and the RCh circuit display positive, negative, and positive–negative impedance phases, respectively. For Rh and RCh plots, h = 200 μS/cm2. F, Impedance phase profiles of the RCh circuit obtained with various values of h. Note that both the peak positive phase value and the frequency at which the crossover from positive to negative phase occurs increase with increase in h. G, Voltage responses (green) of the RCh circuit to sinusoidal currents (black; 100 pA peak to peak) of various frequencies illustrate the lead in the steady-state voltage response at lower frequencies followed by the lag at higher frequencies. It may be noted that the steady-state response evolves over the first few cycles because of the interplay between activation/deactivation of h channels and the passive RC circuit. The red arrows indicate the locations of the voltage peak for the third cycle; their locations may be compared with the peak of the current injection (the black line) to infer the lead–lag behavior spanning input frequencies. Simulations in G were performed at −75 mV, whereas the other simulations were performed at the default −65 mV.
Figure 3.
Figure 3.
Simulations suggest that the inductive phase component of the RCh circuit is dependent on passive and h-channel properties. A, RCh circuit representing a single compartment neuron model, with the h conductance as the only active mechanism. B, Illustration of the ΦL measurement. The plot shows the impedance phase profile of the RCh obtained with maximal h conductance, h, set at 500 μS/cm2 (also in Fig. 2F). The shaded region represents the ΦL and was computed as in Equation 3. ΦL as functions of h (C), membrane voltage (D), voltage at which half-maximal activation occurs for the h channel (E), activation/deactivation time constant of the h channel (F), specific membrane resistivity (G), and capacitance (H). D–H are plotted for two different values of h to illustrate that each of these plots scale up with increase in h (C), without change in their respective functional forms. The dependencies, with respect to each of these parameters, of impedance amplitude and phase profiles and various measurements associated with them are provided in supplemental Figures 2–4 (available at www.jneurosci.org as supplemental material) and Table 1.
Figure 4.
Figure 4.
Whole-cell recordings establish the exponential increase in the inductive component of the input impedance with increase in dendritic recording distance from the soma. A, Responses of a CA1 pyramidal cell dendrite 320 μm away from the soma to the Chirp20 current injection. Each panel depicts the response of the dendrite measured at different membrane voltages, which were set by injecting appropriate depolarizing or hyperpolarizing holding current. The arrows indicate the location of maximal response in each trace. The color code serves as a means to interpret corresponding plots in B. B, ZPPs obtained from traces shown in subpanels of A. Note that both the frequency extent and peak amplitude of positive phase values increase with membrane hyperpolarization. C, Total inductive phase of the input impedance (ΦL) computed from ZPPs shown in B illustrates its increase with hyperpolarization, quantitatively confirming observations arrived through visual inspection of B. Corresponding impedance amplitude profiles and other resonance properties for traces in A are given in supplemental Figure 5, B and C (available at www.jneurosci.org as supplemental material). D, Schematic of the somatoapical trunk, depicting the experimental design for assessing inductive phase as a function of distance from the soma. Voltage responses of the soma and dendrites at various distances (up to 320 μm away from the soma) to the Chirp20 stimulus were recorded locally using a whole-cell patch-clamp electrode (Vm). Colors of markers along the somatoapical trunk serve as codes for corresponding distances in E and F. E, In the measured voltage range of −75 mV to −55 mV, regardless of distance from soma, total inductive phase of input impedance increases with hyperpolarization. F, Typical ZPPs, measured at −70 mV, corresponding to somatic and various dendritic distances, each obtained from different neurons, color-coded as in D. Note that both the frequency extent and peak amplitude of positive phase values increase with distance from soma. G, Total inductive phase of dendritic input impedance increases exponentially (exponential fit: −70 mV, τ = 73.53 μm; −65 mV, τ = 71.43 μm; −60 mV, τ = 86.42 μm) with distance from the soma. The number within parentheses at each distance value is the number of somatic or dendritic recordings performed to arrive at the plots shown in E and G. All error bars represent SEMs.
Figure 5.
Figure 5.
Pretreatment with ZD7288 abolishes the inductive component of input impedance along the somatoapical trunk. A, Responses of a CA1 pyramidal cell dendrite 280 μm away from the soma to the Chirp20 current injection. Each panel depicts the response of the dendrite measured at different membrane voltages. The arrows indicate the location of maximal response in each trace. The color code serves as a means to interpret corresponding plots in B. B, ZPPs obtained from traces shown in subpanels of A. Note that the inductive component is zero for all measured voltages, because the impedance phase never gets positive. Corresponding impedance amplitude profiles for traces in A are given in supplemental Figure 5D (available at www.jneurosci.org as supplemental material). C, Schematic of the somatoapical trunk, with colors of markers serving as codes for corresponding distances in D. At all measured voltages (D) and at all distances from the soma (E), the total inductive phase (ΦL) of the local input impedance is close to zero. The number within parentheses at each distance value is the number of somatic or dendritic recordings performed to arrive at the plots shown in D and E. All error bars represent SEMs.
Figure 6.
Figure 6.
Whole-cell recordings obtained from ZD7288-pretreated slices indicate that membrane time constant and local input capacitance do not significantly change with distance from the soma. A, Schematic of the somatoapical trunk, depicting the experimental design for estimating membrane time constant as a function of distance from the soma. In ZD7288-pretreated slices, voltage responses of the soma and dendrites at various distances (up to 300 μm away from the soma) to the Chirp20 stimulus and to a hyperpolarizing current pulse (100 pA) were recorded locally using a whole-cell patch-clamp electrode (Vm). The response to the Chirp20 stimulus and the hyperpolarizing pulse were used to estimate membrane time constant in the frequency domain (B) and in the time domain (C), respectively. Colors of markers serve as codes for corresponding distances in D and E and G and H. B, Plot illustrating a Lorentzian fit (black) to the ZAP obtained from pyramidal cell dendrite located at 280 μm away (red) from the soma (same dendrite as that shown in Fig. 5A). The fit parameters were impedance amplitude at zero frequency |Z(0)| = 124.84 MΩ, membrane time constant τ = 75.03 ms, and local input capacitance Cin = 601 pF. C, Plot illustrating a double exponential fit (black) to the ZAP obtained from pyramidal cell dendrite located at 280 μm away (red) from the soma (same dendrite as in B). The fit parameters were input resistance Rin = 112.10 MΩ, membrane time constant τ = 60.65 ms, and local input capacitance Cin = 530 pF. The plots of membrane time constant estimated using frequency (D) and time (E) domain methods as a function of membrane voltage for various distances, and as functions of distance from the soma (F) are provided. Similar plots for local input capacitance are also provided (G–I) in the same order. In F and I, the closed and open circles indicate frequency and time domain estimates, respectively. These plots show that membrane time constant and local input capacitance do not significantly change with distance from the soma, and that the estimates obtained from time and frequency domain methods are not significantly different across various distances from the soma. The number of somatic or dendritic recordings performed to arrive at plots D–I are the same as those shown in Figure 5E. All error bars represent SEMs.
Figure 7.
Figure 7.
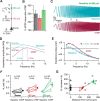
LTP is accompanied by spatially widespread changes in intrinsic phase response. A, Schematic of the somatoapical trunk depicting the experimental design for assessing LTP-associated plasticity in inductive phase as a function of distance from the soma. Voltage responses of the soma and dendrites at various distances (up to ∼300 μm from the soma) were recorded locally using a whole-cell patch-clamp electrode (Vm). Recordings along the somatoapical trunk were binned into three subpopulations (soma, 125 μm, and 250 μm), depending on the distance of the recording location from the soma. Colors of markers along the somatoapical trunk serve as codes for corresponding distances in B, F, and G. B, Summary plot depicting percentage of EPSP slope measured, for the three subpopulations, at 35–40 min after ATBP, computed with respect to baseline values. C, Response of a dendrite, located at 280 μm from the soma, to the Chirp15 stimulus during the baseline period and 40 min after ATBP. The arrows in corresponding colors indicate the location of maximal response in each trace, also illustrating a rightward shift in this location in the ATBP trace with respect to that in the baseline trace. The color code serves as a means to interpret corresponding plots in D and E. D, Impedance amplitude profile computed from corresponding traces in C. The dotted lines indicate the fR and the maximal impedance amplitude (|Z|max) for each of the two traces. E, Impedance phase profile computed from corresponding traces in C. ATBP-induced increases in the amount and the extent of positive phase component may be noted by comparing the ATBP plot to the baseline plot. F, Population plots of ΦL measured before (baseline; open circles) and 40 min after ATBP (ATBP; solid circles) show significant increases in ΦL (paired Student's t test) after ATBP at all three subpopulations. G, Scatterplot of data in F. Each open circle represents the percentage of increase, at 35–40 min after ATBP, relative to the respective baseline value of ΦL in a given experiment. The solid circles represent the average distance and average plasticity for the three populations. The percentage increases in ΦL were not significantly different across the three populations [Kruskal–Wallis test yielded a significant difference (p = 0.0326); however, a post hoc Dunn's test did not show significant differences (p > 0.05) between any two of the three populations]. All error bars represent SEMs.
Figure 8.
Figure 8.
LTP-associated plasticity in impedance properties is attributable to changes in the h current, and not to changes in passive properties. A, RCh circuit representing a single compartment neuron model, with the h conductance as the only active mechanism. B, Increase in resonance frequency in the model can be obtained by either a reduction in Rm or Cm or an increase in h (Table 1). ZAPs for increasing resonance frequency (fR) from a baseline (black, fR = 5.8 Hz; maximal impedance amplitude |Z|max = 55.9 MΩ) through a twofold reduction in Cm (green, fR = 8.3 Hz; |Z|max = 62.4 MΩ), a threefold reduction in Rm (red, fR = 6.8 Hz; |Z|max = 26.2 MΩ), or a twofold increase in h (blue, fR = 7.8 Hz; |Z|max = 45.7 MΩ) are shown. C, Percentage changes from the baseline (black in B) impedance amplitude, |Z|, obtained by altering only Rm (red) or Cm (green) or h (blue) plotted as a function of frequency. D, Experimental design for ATBP. Details are the same as Figure 7A. E, ZAPs of a dendrite, located at 100 μm from the soma, computed during the baseline period and 40 min after ATBP. The increase in resonance frequency (numbers close to the x-axis) and the reduction in the maximal impedance amplitude (numbers close to the y-axis) may be noted. Representative ZAPs before and after ATBP for the somatic population and the 250 μm dendritic subpopulations are provided in supplemental Figure 6B (available at www.jneurosci.org as supplemental material) and Figure 7D, respectively. F, Average percentage change in |Z| obtained for each of the three subpopulations plotted as a function of frequency. This was computed by dividing ZAP obtained after ATBP by the corresponding ZAP during baseline (example shown in E) for each somatic and dendritic recording, converting the ratio to percentage change, and averaging these percentages over all recordings within the three subpopulations. G, To quantify the average percentage change in |Z| as a function of frequency, we split the analyzed frequency range (0–15 Hz) to three 5 Hz groups, and measured the area under the curves (AUCs) shown in E for each of the three subpopulations. For all three subpopulations (soma, 125 μm, and 250 μm), the amount of changes in higher frequencies was significantly lower than those at lower frequencies. Color-coded asterisk (*) above a group represents that the values within that group were significantly different compared with the values in the 0–5 Hz group of the same subpopulation; none of the other comparisons was significantly different. Explicitly, within all three subpopulations, the values in the 5–10 Hz group and the 10–15 Hz group were significantly less than those in the 0–5 Hz group (repeated-measures ANOVA, p < 0.0001, followed by Bonferroni's multiple-comparison test, p < 0.01). In all three subpopulations, the values in the 5–10 Hz group were not significantly different from those in the 10–15 Hz range (Bonferroni's multiple-comparison test, p > 0.05). Across subpopulations, within each of the three frequency ranges, none of the values was significantly different from the other (one-way ANOVA, p > 0.05). H, Population plots of maximal impedance amplitude (|Z|max) measured before (baseline; open circles) and 40 min after ATBP (ATBP; solid circles) show significant reductions in |Z|max (paired Student's t test) after ATBP at all three subpopulations. I, Scatterplot of data in H. Each open circle represents the percentage of reduction, at 35–40 min after ATBP, relative to the respective baseline value of |Z|max in a given experiment. The solid circles represent the average distance and average plasticity for the three subpopulations. The percentage reductions in |Z|max were not significantly different across the three subpopulations (Kruskal–Wallis test, p > 0.4). All error bars represent SEMs.

References

    1. Armstrong-Gold CE, Rieke F. Bandpass filtering at the rod to second-order cell synapse in salamander (Ambystoma tigrinum) retina. J Neurosci. 2003;23:3796–3806. - PMC - PubMed
    1. Brager DH, Johnston D. Plasticity of intrinsic excitability during long-term depression is mediated through mGluR-dependent changes in Ih in hippocampal CA1 pyramidal neurons. J Neurosci. 2007;27:13926–13937. - PMC - PubMed
    1. Burgess N, Barry C, O'Keefe J. An oscillatory interference model of grid cell firing. Hippocampus. 2007;17:801–812. - PMC - PubMed
    1. Buzsaki G. Theta oscillations in the hippocampus. Neuron. 2002;33:325–340. - PubMed
    1. Cantrell AR, Catterall WA. Neuromodulation of Na+ channels: an unexpected form of cellular plasticity. Nat Rev Neurosci. 2001;2:397–407. - PubMed

Publication types

MeSH terms

Substances

LinkOut - more resources