. 2008 Jun 3;105(22):7833-8.
doi: 10.1073/pnas.0802063105. Epub 2008 May 28.

Cidea is associated with lipid droplets and insulin sensitivity in humans

Affiliations

Cidea is associated with lipid droplets and insulin sensitivity in humans

Vishwajeet Puri et al. Proc Natl Acad Sci U S A. .

Abstract

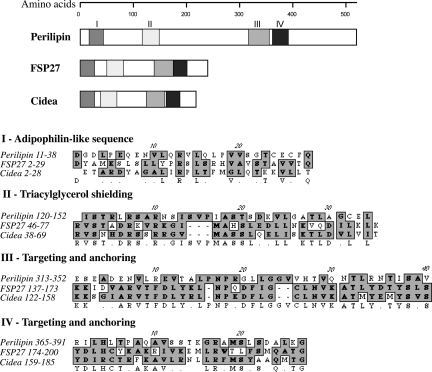
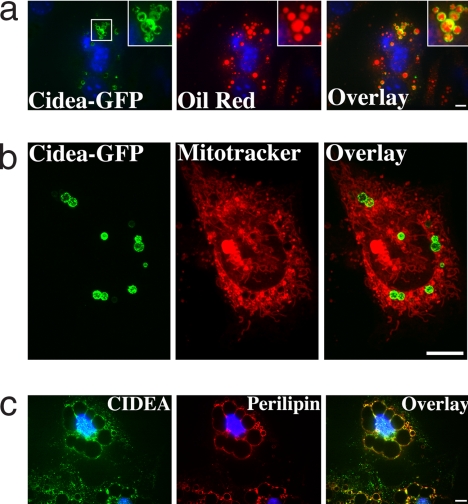
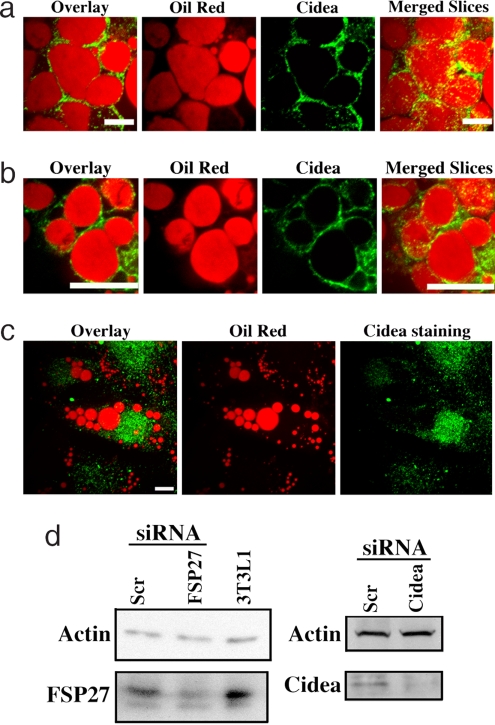
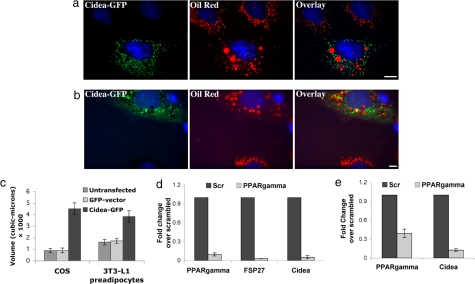
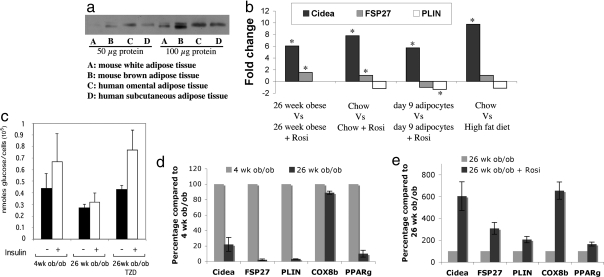
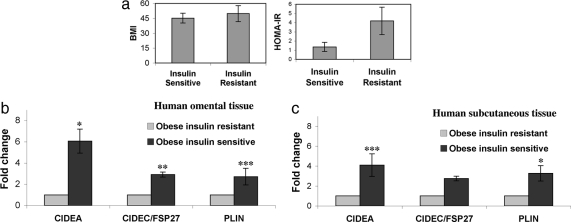
Storage of energy as triglyceride in large adipose-specific lipid droplets is a fundamental need in all mammals. Efficient sequestration of fat in adipocytes also prevents fatty acid overload in skeletal muscle and liver, which can impair insulin signaling. Here we report that the Cide domain-containing protein Cidea, previously thought to be a mitochondrial protein, colocalizes around lipid droplets with perilipin, a regulator of lipolysis. Cidea-GFP greatly enhances lipid droplet size when ectopically expressed in preadipocytes or COS cells. These results explain previous findings showing that depletion of Cidea with RNAi markedly elevates lipolysis in human adipocytes. Like perilipin, Cidea and the related lipid droplet protein Cidec/FSP27 are controlled by peroxisome proliferator-activated receptor gamma (PPARgamma). Treatment of lean or obese mice with the PPARgamma agonist rosiglitazone markedly up-regulates Cidea expression in white adipose tissue (WAT), increasing lipid deposition. Strikingly, in both omental and s.c. WAT from BMI-matched obese humans, expression of Cidea, Cidec/FSP27, and perilipin correlates positively with insulin sensitivity (HOMA-IR index). Thus, Cidea and other lipid droplet proteins define a novel, highly regulated pathway of triglyceride deposition in human WAT. The data support a model whereby failure of this pathway results in ectopic lipid accumulation, insulin resistance, and its associated comorbidities in humans.


Conflict of interest statement

The authors declare no conflict of interest.

Figures

Fig. 1.
Fig. 1.
Predicted structural motifs of mouse Cidea and FSP27 based on sequence homology with mouse perilipin. FSP27 (amino acids 2–29) and Cidea (amino acids 2–28) show sequence similarity of 32% and 22%, respectively, with a portion of the adipophilin-like sequence of perilipin (amino acids 11–38, I). In perilipin, amino acids 120–152 (II) represents a section of the triacyglycerol shielding region that plays a role in shielding stored triacylglycerol from cytosolic lipases. It has a sequence similarity of 40% with FSP27 (amino acids 46–77) and 51% with Cidea (amino acids 38–69). Similarly, lipid droplet targeting and anchoring regions of perilipin (amino acids 313–352, III; and amino acids 365–391, IV) have sequence similarities of 40% and 30% with respective sequences of FSP27 (amino acids 137–173 and 174–200) and 38% and 48% similarities with Cidea (amino acids 122–158 and 159–185).
Fig. 2.
Fig. 2.
Cidea localizes at the surface of lipid droplets and colocalizes with perilipin in adipocytes. (a) Cidea-GFP expression in day-4 3T3-L1 adipocytes (Left). (Center) Staining of lipid droplets with oil red. The overlay of the confocal images (Right) clearly demonstrates the association of Cidea with lipid droplets. (Scale bar: 10 μm.) (b) Confocal microscopic image of a 3T3-L1 adipocyte (day 4) expressing Cidea-GFP. (Left) Expression of Cidea after 48 h of transfecting Cidea-GFP cDNA. (Center) Mitochondria stained with MitoTracker. (Scale bar: 10 μm.) The individual Z-sections are displayed in Fig. S4. (c) Immunofluorescence confocal microscopy displaying expression of endogenous CIDEA in human adipocytes (Left) using monoclonal anti-CIDEA (Novus Biologicals) antibody and anti-mouse Alexa Fluor 488 (Molecular Probes) secondary antibody. For perilipin staining (Center), guinea pig anti-perilipin primary antibody was stained with Texas red-labeled rabbit polyclonal to guinea pig IgG (Abcam). (Scale bar: 10 μm.)
Fig. 3.
Fig. 3.
FSP27 depletion has no effect on Cidea localization at the surface of lipid droplets in adipocytes. Immunofluorescence confocal microscopy displaying localization of endogenous Cidea and staining of lipid droplets with oil red in cultured brown adipocytes transfected with scrambled siRNA (a), transfected with FSP27 siRNA (b), and transfected with Cidea siRNA (c). In a and b the left three panels show a single optical plane of 4 μm each and the far right panels display the merged Z-sections. (Scale bar: 10 μm.) (d) Western blots showing the expression of FSP27 and Cidea in cultured brown adipocytes transfected with FSP27 or Cidea siRNA. (Left) Protein lysate from 3T3-L1 adipocytes was loaded as a positive control for FSP27. Actin was labeled as a loading control.
Fig. 4.
Fig. 4.
Cidea-GFP expression in COS cells or 3T3-L1 preadipocytes enhances lipid droplet size. (a) COS cells were transfected with Cidea-GFP and cultured for 24 h before fixing and staining with oil red. Eight hours after transfection a 400 μM oleic acid/BSA mixture (from Sigma–Aldrich) was added to the medium. (b) 3T3-L1 preadipocytes were transfected with Cidea-GFP and cultured for 24 h before fixing and staining with oil red. Eight hours after transfection the 400 μM oleic acid/BSA mixture was added to the medium. (c) Morphometric analysis of lipid droplets in COS cells and 3T3-L1 preadipocytes that were transfected with Cidea-GFP or GFP vector alone or untransfected under the same conditions as in a and b. Student's t test comparison between untransfected and Cidea-GFP or comparison between GFP vector alone and Cidea-GFP in COS cells, P < 0.0001; in 3T3-L1 preadipocytes, P < 0.001. (d) Quantitative real-time analysis performed by using RNA isolated from 3T3-L1 adipocytes. The effect of siRNA-mediated PPARγ knockdown on Cidec/FSP27 and Cidea was measured (P < 0.0001). (e) Quantitative real-time analysis performed by using RNA isolated from differentiated brown adipocytes after PPARγ knockdown (P < 0.0001).
Fig. 5.
Fig. 5.
Rosiglitazone treatment of cultured adipocytes or intact mice markedly increases Cidea expression. (a) Western blot analysis of Cidea expression in mouse and human adipose tissues. (b) Fold change of Cidea, FSP27, and perilipin mRNA in 3T3-L1 adipocytes and primary adipocytes isolated from mice after rosiglitazone treatment based on expression data using MG-U74 Affymetrix GeneChips. Total RNA was isolated from 3T3-L1 adipocytes treated with or without 1 μM rosiglitazone for 24 h or primary fat cells of mice treated with or without 5 mg/kg rosiglitazone each day for 2 weeks. *, P < 0.05. (c) The graph represents amount of d-[U-14C]-glucose taken up and converted to triglycerides by primary adipocytes from 4-week-old ob/ob mice, 26-week-old ob/ob mice, and 26-week-old ob/ob mice treated with 5 mg/kg rosiglitazone each day for 2 weeks. Glucose conversion to triglyceride glycerol in adipocytes plus or minus insulin was calculated to nanomoles per 105 cells. The data represent the mean ± SEM of three experiments for each age group and condition. (d) Quantitative real-time analysis performed by using RNA isolated from adipose tissue (epididymal fat pads) of 4-week-old ob/ob and 26-week-old ob/ob mice. The 36B4 gene was used as a reference gene for quantitative analysis (P < 0.05). (e) Quantitative real-time analysis performed by using RNA isolated from adipose tissue (epididymal fat pads) of 26-week-old ob/ob mice and 26-week-old ob/ob mice treated with 5 mg/kg rosiglitazone each day for 2 weeks. The 36B4 gene was used as a reference gene for quantitative analysis (P < 0.05). All procedures in Fig. 5 were carried out according to the guidelines of the University of Massachusetts Medical School Institutional Animal Care and Use Committee.
Fig. 6.
Fig. 6.
Cidea mRNA levels are higher in WAT of obese, insulin-sensitive subjects as compared with obese, insulin-resistant subjects matched for BMI. (a) BMI and HOMA-IR comparisons of insulin-sensitive (n = 13) and insulin-resistant (n = 7) obese human subjects. Please note that BMI does not predict the degree of insulin resistance in this cohort of obese patients. HOMA-IR of 2.3 was used as a cut point to categorize the obese patients as insulin-sensitive (HOMA-IR ≤ 2.3) or insulin-resistant. (b) Real-time PCR analysis depicting a fold change in mRNA levels of various genes in omental adipose tissue of obese, insulin-sensitive individuals as compared with obese, insulin-resistant subjects. *, P < 0.0001; **, P < 0.001; ***, P < 0.05. (c) Real-time PCR analysis depicting a fold change in mRNA levels of various genes in s.c. adipose tissue of obese, insulin-sensitive individuals as compared with obese, insulin-resistant subjects. *, P < 0.0001; ***, P < 0.05. Fresh human omental and s.c. tissues were obtained under informed consent from patients undergoing gastric bypass surgery (University of Massachusetts Medical School Institution Review Boards docket number H-11033). Tissues were frozen after procurement and stored at −80°C for subsequent RNA and protein extractions.

Similar articles

Cited by

References

    1. Smyth S, Heron A. Diabetes and obesity: The twin epidemics. Nat Med. 2006;12:75–80. - PubMed
    1. Rajala MW, Scherer PE. Minireview: The adipocyte—at the crossroads of energy homeostasis, inflammation, and atherosclerosis. Endocrinology. 2003;144:3765–3773. - PubMed
    1. Ferrannini E, Barrett EJ, Bevilacqua S, DeFronzo RA. Effect of fatty acids on glucose production and utilization in man. J Clin Invest. 1983;72:1737–1747. - PMC - PubMed
    1. Boden G, Chen X, Ruiz J, White JV, Rossetti L. Mechanisms of fatty acid-induced inhibition of glucose uptake. J Clin Invest. 1994;93:2438–2446. - PMC - PubMed
    1. Dresner A, et al. Effects of free fatty acids on glucose transport and IRS-1-associated phosphatidylinositol 3-kinase activity. J Clin Invest. 1999;103:253–259. - PMC - PubMed

Publication types

MeSH terms