. 2008 Aug;100(2):932-44.
doi: 10.1152/jn.01360.2007. Epub 2008 May 28.

Tonically active inhibition selectively controls feedforward circuits in mouse barrel cortex

Affiliations

Tonically active inhibition selectively controls feedforward circuits in mouse barrel cortex

Esther I Krook-Magnuson et al. J Neurophysiol. 2008 Aug.

Abstract

Tonic inhibition mediated by extrasynaptic gamma-aminobutyric acid type A (GABA A) receptors is a powerful conductance that controls cell excitability. Throughout the CNS, tonic inhibition is expressed at varying degrees across different cell types. Despite a rich history of cortical interneuron diversity, little is known about tonic inhibition in the different classes of cells in the cerebral cortex. We therefore examined the cell-type specificity and functional significance of tonic inhibition in layer 4 of the mouse somatosensory barrel cortex. In situ hybridization and immunocytochemistry showed moderate delta-subunit expression across the barrel structures. Whole cell patch-clamp recordings additionally indicated that significant levels of tonic inhibition can be found across cell types, with differences in the magnitude of inhibition between cell types. To activate tonic currents, we used 4,5,6,7-tetrahydroisoxazolo[5,4-c]pyridin-3-ol (THIP, a superagonist at delta-subunit-containing GABA A receptors) at a concentration that did not affect synaptic decay kinetics. THIP produced greater shifts in baseline holding current in inhibitory cells (low-threshold spiking [LTS], 109 +/- 17 pA; fast spiking [FS], 111 +/- 15 pA) than in excitatory cells (39 +/- 10 pA; P < 0.001). In addition to these differences across cell types, there was also variability within inhibitory cells. FS cells with faster action potentials had larger baseline shifts. Because FS cells are known mediators of feedforward inhibition, we tested whether THIP-induced tonic conductance selectively controls feedforward circuits. THIP application resulted in the abolishment of the inhibitory postsynaptic potential in thalamic-evoked disynaptic responses in a subset of excitatory neurons. These data suggest multiple feedforward circuits can be differentiated by the inhibitory control of the presynaptic inhibitory neuron.


Figures

FIG. 1.
FIG. 1.
Histochemical visualization of the barrel field and illustration of γ-aminobutyric acid type A (GABAA) receptor δ-subunit expression in mouse barrel cortex through in situ hybridization and immunofluoresence staining. Sections are sliced tangential to the pial surface to reveal barrels in layer 4. A: cytochrome oxidase–stained sections show metabolically active cells in the barrels. Barrels β, γ, and δ and barrel rows A–E are labeled. B: adjacent section counterstained with cresyl violet. Layers 1–6 are labeled. The barrel pattern of the posteromedial barrel subfield is marked by asterisks in B and C. C: film autoradiogram of the section in B. Scale bar in C applies to A and B as well. D: schematic drawing of the barrel pattern from the cresyl violet–stained slice in B. Barrels α, β, γ, and δ and barrel rows A–E are labeled. E: high magnification of δ mRNA expression in B demonstrates the expression of δ mRNA clusters mainly located in specific cells (black arrows). F: immunofIuoresence staining of layer 4 barrel cortex neurons illustrates the specific expression of the δ-subunit (green) in cells (white arrows).
FIG. 2.
FIG. 2.
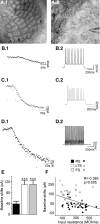
Differences in inducible levels of tonic inhibition. A: live tangential slice, capturing layer 4 barrel rows A–E, and a higher-magnification shot showing neurons in the barrel wall. B: a voltage-clamp trace showing an excitatory (regular-spiking [RS]) cell's baseline shift in holding current in response to 20 μM 4,5,6,7-tetrahydroisoxazolo[5,4-c]pyridin-3-ol (THIP) when held at −60 mV (B.1). The current-clamp trace shows the first full sweep for this cell (B.2). (See methods for cell-typing details and an explanation of terms.) C: a low-threshold spiking (LTS) cell's baseline shift (C.1) and corresponding current-clamp trace (C.2). D: a fast-spiking (FS) cell's voltage-clamp trace (D.1) and corresponding current-clamp trace (D.2). BD: each dot represents an average of 10 ms, with one dot presented for every 2 s. E: summary bar graph of baseline shifts by cell category. All show statistically significant baseline shifts (P < 0.001, Wilcoxon matched-pairs signed-ranks). Both groups of inhibitory cells showed statistically significant larger baseline shifts than RS cells (***P ≤ 0.001, Mann–Whitney U test). Error bars represent SE. F: across all cells there is a negative correlation between input resistance and baseline shift (R = −0.385, P < 0.005).
FIG. 3.
FIG. 3.
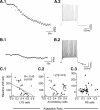
Adaptation ratio and variability of baseline shifts within LTS cells. A: an LTS cell's baseline shift in holding current in response to 20 μM THIP when voltage-clamped at −60 mV (A.1) and this cell's current-clamp trace showing adaptation (A.2). B: an LTS cell showing a smaller baseline shift in response to THIP (B.1) and less adaptation (B.2) than the cell in A. A and B: each dot represents an average of 10 ms, with one dot presented for every 2 s. C: for LTS cells, there is a correlation (R = −0.40, P ≤ 0.05) between adaptation ratio and baseline shift (C.1). Cells shown in A and B are labeled as “A” and “B” in the graph (filled triangles). Across all inhibitory cells, there is no correlation between adaptation ratio and baseline shift (C.2). Note also that the adaptation ratio value of 0.6 is roughly the distinction point between LTS (triangles) and FS cells (gray squares). Although excitatory (RS) cells show a range of adaptation ratios and firing frequency similar to that of LTS cells, there is no correlation (P > 0.9) between baseline shift and adaptation ratio for RS cells (C.3).
FIG. 4.
FIG. 4.
Spike width and variability of baseline shift within FS cells. A: voltage-clamp trace (A.1) showing an FS cell's response to THIP. The current-clamp trace of this cell (A.2) with a thin spike width (A.3). B: voltage (B.1) and current traces (B.2) for an FS cell with a thicker spike width (B.3). The same window of time is shown in A.3 and B.3. A and B: each dot represents an average of 10 ms, with one dot presented for every 2 s. C: within FS cells, there is a correlation between spike width and baseline shift (R = −0.71, P < 0.005, C.1). Cells shown in A and B are indicated (black squares). This correlation is lacking in LTS cells (C.2) and RS cells (C.3) (P > 0.8).
FIG. 5.
FIG. 5.
THIP activates extrasynaptic GABAA receptors and reduces spontaneous inhibitory postsynaptic current (sIPSC) frequency. A: voltage-clamp trace showing an LTS cell's response to 20-μM THIP application (first arrow) and washout (second arrow). This same cell is presented in AE. Representative traces prior to (B) and during (C) THIP application. D: cell-typing current-clamp trace of this cell. E: averaged unitary IPSCs before (black) and in the presence of THIP (gray, amplitudes normalized). F: summary bar graph of the mean weighted tau values (see methods) by cell type. The asterisk notes a slight decrease in weighted tau in RS cells (*P < 0.05). Note that there is no enhancement of IPSC decay. G: summary bar graph of the effects of THIP on sIPSC frequency by cell category. Note that, for all cell types, THIP produces a significant decrease in sIPSC frequency (****P < 0.00001; **P < 0.01). Error bars represent SE. H: bicuculline (100 μM, second arrow, a GABAA antagonist) blocks the baseline shift induced by THIP (first arrow).
FIG. 6.
FIG. 6.
Effects of THIP-induced currents on input resistance and firing rate. AC: THIP induces significant (P < 0.05, Wilcoxon matched-pairs signed-ranks) and reversible decreases in input resistance in RS cells (A), LTS cells (B), and FS cells (C). In all cell types, this is capable of shifting the firing frequency vs. input current (fI) plot. Note that there is a simple subtractive (rather than altered gain) effect of THIP on firing frequency. In all, black represents pre-THIP, gray represents in THIP, and white represents washout. Error bars represent SE.
FIG. 7.
FIG. 7.
Selective inhibition of feedforward inhibitory circuits. A: thalamocortical slice preparation showing the thalamus and barrel pattern in layer 4 (between lines). B: thalamic-evoked monosynaptic response in an excitatory neuron following stimulation of thalamocortical fibers. Application of THIP has no effect on excitatory postsynaptic potential (EPSP) amplitude in excitatory neurons (B.1: gray trace; B.2: effect of THIP on EPSP amplitude for all cells). C and D: thalamic-evoked disynaptic response of 2 excitatory neurons showing the characteristic EPSP–IPSP (inhibitory postsynaptic potential) response. C: representative averaged traces from a cell in which the IPSP is abolished by THIP application. Each trace is an average of 10 sweeps in control (top), in the presence of THIP (middle), and washout (bottom). The elimination of the IPSP suggests that this cell receives inhibitory synaptic input that is sensitive to THIP. In all cases where THIP abolished the IPSP, the excitatory neuron showed a “stuttering” action potential firing pattern (inset is a trace illustrating the firing properties of the cell in response to a depolarizing current pulse). This cell is noted as RSst for a regular spiking, stuttering cell. D: representative averaged traces from a cell in which the IPSP remains in the presence of THIP, suggesting that this cell receives inhibitory synaptic input that is not sensitive to THIP. Inset illustrates the cell's spiking pattern as a classic regular-spiking excitatory cell. The scale bar for the spiking pattern is the same in D as in C, 20 mV vertical, 200 ms horizontal. E: mean data illustrating the effect of THIP on the amplitude of the EPSP in the disynaptic response for both RSst and classical RS cells. F: mean data illustrating the selective reduction of the IPSP in RSst cells. Images of biocytin-filled cells for a cell with RS firing pattern (G) and RSst firing pattern (H). RS cells typically reveal a spiny stellate morphology and RSst cells have a star pyramid morphology. The scale bar for the spiking patterns shown in G and H represents 20 mV vertical, 200 ms horizontal.

Similar articles

Cited by

References

    1. Agmon A, Connors BW. Thalamocortical responses of mouse somatosensory (barrel) cortex in vitro. Neuroscience 41: 365–379, 1991. - PubMed
    1. Agmon A, Connors BW. Correlation between intrinsic firing patterns and thalamocortical synaptic responses of neurons in mouse barrel cortex. J Neurosci 12: 319–329, 1992. - PMC - PubMed
    1. Ali AB, Bannister AP, Thomson AM. Robust correlations between action potential duration and the properties of synaptic connections in layer 4 interneurones in neocortical slices from juvenile rats and adult rat and cat. J Physiol 580: 149–169, 2007. - PMC - PubMed
    1. Bacci A, Rudolph U, Huguenard JR, Prince DA. Major differences in inhibitory synaptic transmission onto two neocortical interneuron subclasses. J Neurosci 23: 9664–9674, 2003. - PMC - PubMed
    1. Barnard EA, Skolnick P, Olsen RW, Mohler H, Sieghart W, Biggio G, Braestrup C, Bateson AN, Langer SZ. International Union of Pharmacology. XV. Subtypes of gamma-aminobutyric acidA receptors: classification on the basis of subunit structure and receptor function. Pharmacol Rev 50: 291–313, 1998. - PubMed

Publication types

MeSH terms

LinkOut - more resources