Comparative Study
. 2009 Feb;85(2):155-63.
doi: 10.1038/clpt.2008.95. Epub 2008 May 28.

Pharmacogenetic pathway analysis of docetaxel elimination

Affiliations
Comparative Study

Pharmacogenetic pathway analysis of docetaxel elimination

S D Baker et al. Clin Pharmacol Ther. 2009 Feb.

Abstract

The purpose of this study was to evaluate the affinity of docetaxel for 14 transporter proteins and assess the functional significance of 17 variants in five genes involved in drug elimination. Among the transfected models investigated, OATP1B3 (SLCO1B3) was identified as the most efficient influx transporter for docetaxel. None of the observed genotypes (SLCO1B3, ABCB1, and ABCC2) was related with docetaxel clearance in 92 white patients (P > 0.17). However, the simultaneous presence of the CYP3A4*1B and CYP3A5*1A alleles was associated with a 64% increase in docetaxel clearance (P = 0.0015), independent of both sex and CYP3A activity (as determined using the erythromycin breath test). This haplotype was also associated with increased midazolam clearance in another population (P = 0.0198). An analysis of the CYP3A locus among CEPH-HapMap samples revealed that CYP3A4*1B is present exclusively among a subset of CYP3A5 expressors. Therefore, future studies should first stratify the population on the basis of CYP3A5 genotype and then compare CYP3A activity between individuals with and without the CYP3A4*1B allele.


Conflict of interest statement

Conflict of Interest: M.A.C. is a consultant to and on the speakers' bureau of Sanofi-Aventis. The other authors declared no conflict of interest.

Figures

Figure 1
Figure 1
Accumulation of docetaxel by (a) Xenopus laevis oocytes (hatched bars) or mammalian cells (black bars) expressing solute carriers, and (b) mammalian cells expressing ATP-binding cassette transporters. The data represent the mean of 6–33 observations, and are expressed as a percentage of the control (white bars). For clarity, only a single control bar is shown for the solute carriers. Error bars represent the standard error. The asterisk (*) denotes significant difference from the control value (P < 0.05).
Figure 2
Figure 2
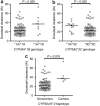
Docetaxel clearance as a function of (a) CYP3A4*1B genotype, (b) CYP3A5*3C genotype, and (c) combined presence of the CYP3A4*1B and CYP3A5*1A alleles (haplotype CYP3A4/5*2). Each symbol represents an individual patient, and horizontal lines indicate median values. In b, the black circle represents the only individual with two copies of the CYP3A5*1A allele, and the black triangles in the CYP3A5 non-expressors represent carriers of the CYP3A4*1B allele. In c, all individuals in the group of CYP3A4/5*2 carriers had the CYP3A4*1A*1B/CYP3A5*1A*3C diplotype, and the black triangles in the group of noncarriers represent CYP3A5 expressors.
Figure 3
Figure 3
Association of the CYP3A4/5*2 haplotype with (a) midazolam clearance and (b) erythromycin breath test concentration at 20 min (ERMBT C20). Each symbol represents an individual patient, and horizontal lines indicate median values. The black triangles in the group of noncarriers represent CYP3A5 expressors.
Figure 4
Figure 4
Docetaxel clearance as a function of the most common variant haplotypes in (a) SLCO1B3 (haplotype GAAGAT at positions 334, 439, 699, 767, 1559, and 1679; SLCO1B3*1), (b) ABCB1 (haplotype CGC at positions 1236, 2677, and 3435; ABCB1*1), and (c) ABCC2 (haplotype ACGTCG at positions −1019, −24, 1249, IVS26 −34, 3972, and 4544; ABCC2*1). Each symbol represents an individual patient, and horizontal lines indicate median values.
Figure 5
Figure 5
Visual genotypes of the CYP3A locus in CEPH-HapMap samples stratified on the basis of informative CYP3A genotypes. Each sample (identified on the x-axis) is arranged by CYP3A locus SNPs (on the y-axis). Genotypes are color-coded as follows: gray, homozygous wild type; orange, heterozygous; red, homozygous variant. Groups labeled 1 and 2 represent CYP3A5 expressors carrying CYP3A5*1A (rs776746) stratified by the presence or absence of the CYP3A4*1B (rs2740574) allele, respectively. Among CYP3A5 non-expressors, groups labeled 3, 4, 5, and 6 were further segregated by CYP3A7 SNPs, the SNP 3′ of CYP3A4 (rs1233983), and the CYP3A4 intron 7 SNP (rs2246709), respectively.

References

    1. Baker SD, Sparreboom A, Verweij J. Clinical pharmacokinetics of docetaxel: recent developments. Clin Pharmacokinet. 2006;45:235–252. - PubMed
    1. Bruno R, et al. Population pharmacokinetics/pharmacodynamics of docetaxel in phase II studies in patients with cancer. J Clin Oncol. 1998;16:187–196. - PubMed
    1. Bruno R, et al. Alpha-1-acid glycoprotein as an independent predictor for treatment effects and a prognostic factor of survival in patients with non-small cell lung cancer treated with docetaxel. Clin Cancer Res. 2003;9:1077–1082. - PubMed
    1. Veyrat-Follet C, Bruno R, Olivares R, Rhodes GR, Chaikin P. Clinical trial simulation of docetaxel in patients with cancer as a tool for dosage optimization. Clin Pharmacol Ther. 2000;68:677–687. - PubMed
    1. Hooker AC, et al. Population pharmacokinetic model for docetaxel in patients with varying degrees of liver function: incorporating cytochrome P450 3A activity measurements. Clin Pharmacol Ther - PMC - PubMed

Publication types

MeSH terms