. 2008 May 28;3(5):e2306.
doi: 10.1371/journal.pone.0002306.

A population dynamics analysis of the interaction between adaptive regulatory T cells and antigen presenting cells

Affiliations

A population dynamics analysis of the interaction between adaptive regulatory T cells and antigen presenting cells

David Fouchet et al. PLoS One. .

Abstract

Background: Regulatory T cells are central actors in the maintenance of tolerance of self-antigens or allergens and in the regulation of the intensity of the immune response during infections by pathogens. An understanding of the network of the interaction between regulatory T cells, antigen presenting cells and effector T cells is starting to emerge. Dynamical systems analysis can help to understand the dynamical properties of an interaction network and can shed light on the different tasks that can be accomplished by a network.

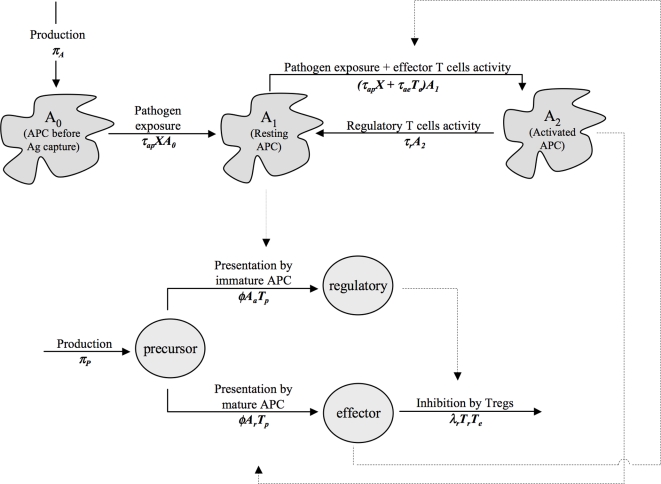
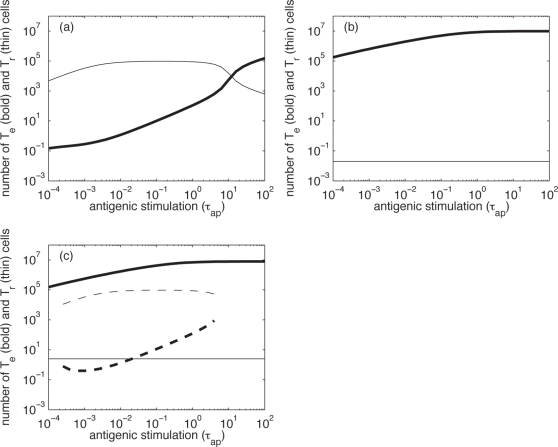
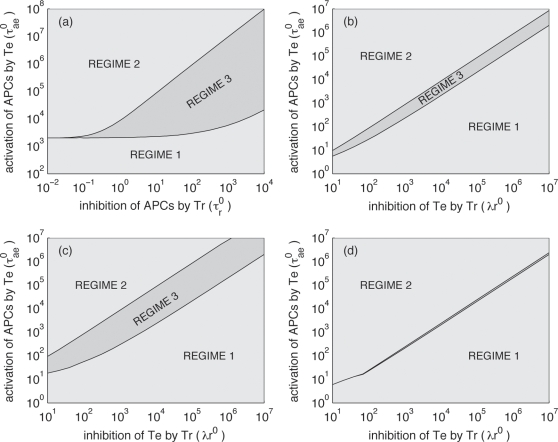
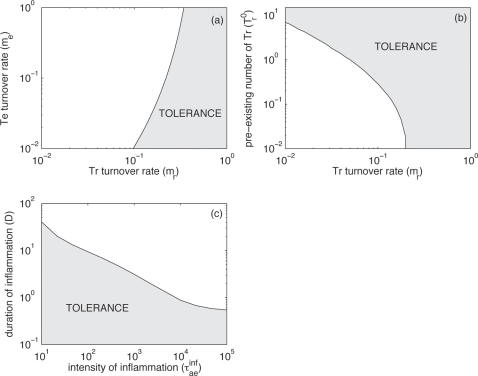
Methodology and principal findings: We used a mathematical model to describe a interaction network of adaptive regulatory T cells, in which mature precursor T cells may differentiate into either adaptive regulatory T cells or effector T cells, depending on the activation state of the cell by which the antigen was presented. Using an equilibrium analysis of the mathematical model we show that, for some parameters, the network has two stable equilibrium states: one in which effector T cells are strongly regulated by regulatory T cells and another in which effector T cells are not regulated because the regulatory T cell population is vanishingly small. We then simulate different types of perturbations, such as the introduction of an antigen into a virgin system, and look at the state into which the system falls. We find that whether or not the interaction network switches from the regulated (tolerant) state to the unregulated state depends on the strength of the antigenic stimulus and the state from which the network has been perturbed.

Conclusion/significance: Our findings suggest that the interaction network studied in this paper plays an essential part in generating and maintaining tolerance against allergens and self-antigens.


Conflict of interest statement

Competing Interests: The authors have declared that no competing interests exist.

Figures

Figure 1
Figure 1. Interaction network of the immune response.
Solid arrows describe the evolution of the different cell types (APCs or lymphocyte T CD4+ cells). Dashed arrows indicate the cell types involved in the changes (for example regulatory T cells are involved in the inhibition of effector T cells). The mathematical model developed in this paper is based on this interaction network. Rates of the mathematical model are recalled under the evolution arrows. To make it clearer, we omitted the death of all cell types in the Figure. The antigen X is not represented here. Note that in the model proposed by Powrie and Maloy (2003), the activity of activated APCs can revert the inhibition of effector T cells by regulatory T cells. For the sake of simplicity, we omitted this interaction here. This does not deeply affect the qualitative nature of the results (results not shown).
Figure 2
Figure 2. Equilibrium states of the system.
Number of effector (bold lines) and regulatory (thin lines) cells in the equilibrium states according to the antigenic stimulation (τap), in: (a) an example of situation with only one stable and strongly regulated equilibrium (τae0 = 102); (b) an example of situation with only one stable and weakly regulated equilibrium (τae0 = 106) and (c) an example of bi-stable situation with an unstable equilibrium in between (τae0 = 104). To distinguish between the two equilibrium states, the strongly regulated one is plotted with dashed lines. Note also that only stable states are presented here. In the bistable regime there is always another equilibrium state that is unstable. λr0 = 104, τr0 = 10 in all the situations.
Figure 3
Figure 3. Impact of the parameters on the nature of the equilibrium regime.
Situations are divided into the 3 regimes described in the main text (see also Fig. 2). (a) For different values of the activation rate of APCs by effector cells (τae0) and different rates of regression of APCs by regulatory T cells (τr0), with λr0 = 104; (b) for different values of the activation rate of APCs by effector T cells (τae0) and different rates of inhibition of effector cells by regulatory T cells (λr0), with τr0 = 1; (c) same as (b) but with τr0 = 10; (d) same as (b) but with τr0 = 0.1.
Figure 4
Figure 4. Factors leading to strong primary immune responses.
Values of the parameters are as in Fig. 2c (basic: τae0 = 104, λr0 = 104, τr0 = 10 and see Table 1) so that we are in the bi-stability region (regime 3). Initially, there are no effector T cells. At time t = 0, one (i.e. the maximum quantity) antigen is introduced (X0 = 1): we neglect the growing phase of the antigen. Grey zones correspond to tolerance, i.e. the system falls into the strongly regulated state. White zones correspond to the development of a strong immune response, i.e. the system falls into the weakly regulated state. (a) Effect of the the effector and regulatory T cells turnover rates (me and mr, respectively), with τap = 10−2; (b) effect of the pre-existing number of regulatory T cells (Tr0) and the regulatory T cells turnover rate (mr), with τap = 10−2; and (c) impact of an inflammatory burst on the development of an immune response, depending on its duration (D) and intensity (τapinf), with τaprest = 10−2 and Tr0 = 1. Note that in Fig. 4a Tr0 = 0.
Figure 5
Figure 5. Stability of the strongly regulated equilibrium.
It is characterized by the mean period of time (D) during which inflammation must be maintained to induce a long lasting immune response. Again values of the parameters are as in Fig. 2c (basic: τae0 = 104, λr0 = 104, τr0 = 10 and see Table 1). (a) Effect of the duration (D) and intensity (τapinf) of the inflammatory burst. The threshold line obtained with the same parameters but for an introduced antigen is reported on the graph as a dashed line (with Tr0 = 1, see Fig. 4d); and (b) Effect of the duration of the inflammatory burst (D) and the regulatory T cells turnover rate (mr), with τapinf = 103. As in Fig. 4 grey zones correspond to tolerance and white zones correspond to the development of a strong immune response. In (a) and (b), τaprest = 10−2.

References

    1. Sakaguchi S, Sakaguchi N, Asano M, Itoh M, Toda M. Immunologic self-tolerance maintained by activated T cells expressing IL-2 receptor α-chains (CD25). Breakdown of a single mechanism of self-tolerance causes various autoimmune diseases. J Immunol. 1995;155:1151–1164. - PubMed
    1. Bluestone JA, Abbas AK. Natural versus adaptive regulatory T cells. Nat Rev Immunol. 2003;3:253–257. - PubMed
    1. Jonuleit H, Schmitt E. The regulatory T cell family: distinct subsets and their interrelations. J Immunol. 2003;171:6323–6327. - PubMed
    1. Jordan MS, Boesteanu A, Reed AJ, Petrone AL, Holenbeck AE, et al. Thymic selection of CD4 CD25 regulatory T cells induced by an agonist self-peptide. Nat Immunol. 2001;2:301–306. - PubMed
    1. Barrat FJ, Cua DJ, Boonstra A, Richards DF, Crain C, et al. In vitro generation of interleukin-10-producing regulatory CD4+ T cells is induced by immunosuppressive drugs and inhibited by T helper type 1 (TH1)- and TH2-inducing cytokines. J Exp Med. 2002;195:603–616. - PMC - PubMed

Publication types

MeSH terms