. 2008 May 28;3(5):e2296.
doi: 10.1371/journal.pone.0002296.

Early neurodegeneration progresses independently of microglial activation by heparan sulfate in the brain of mucopolysaccharidosis IIIB mice

Affiliations

Early neurodegeneration progresses independently of microglial activation by heparan sulfate in the brain of mucopolysaccharidosis IIIB mice

Jérôme Ausseil et al. PLoS One. .

Abstract

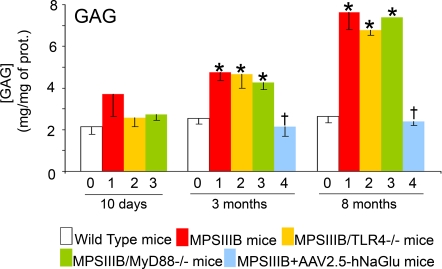
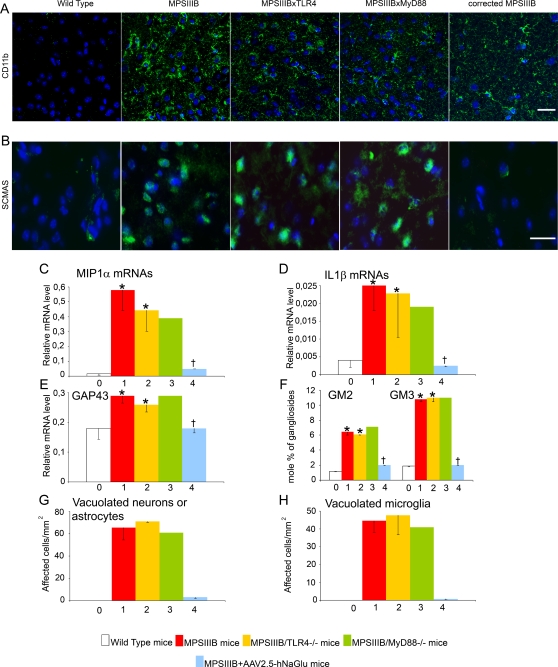
Background: In mucopolysaccharidosis type IIIB, a lysosomal storage disease causing early onset mental retardation in children, the production of abnormal oligosaccharidic fragments of heparan sulfate is associated with severe neuropathology and chronic brain inflammation. We addressed causative links between the biochemical, pathological and inflammatory disorders in a mouse model of this disease.

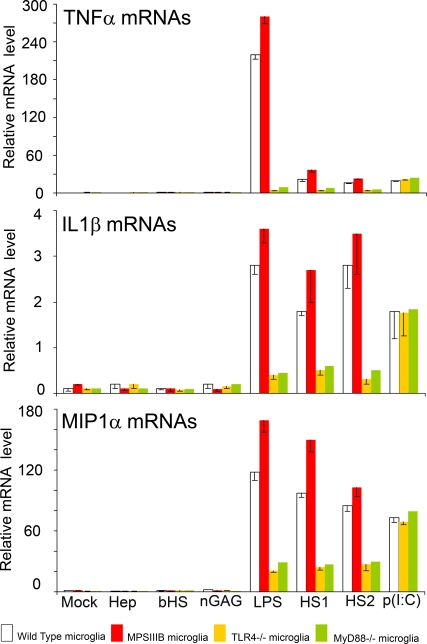
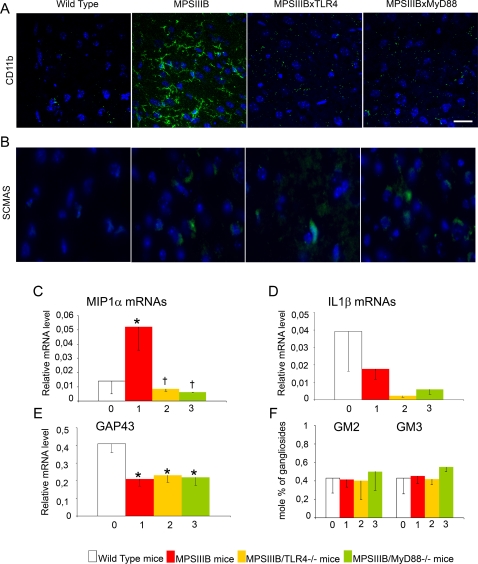
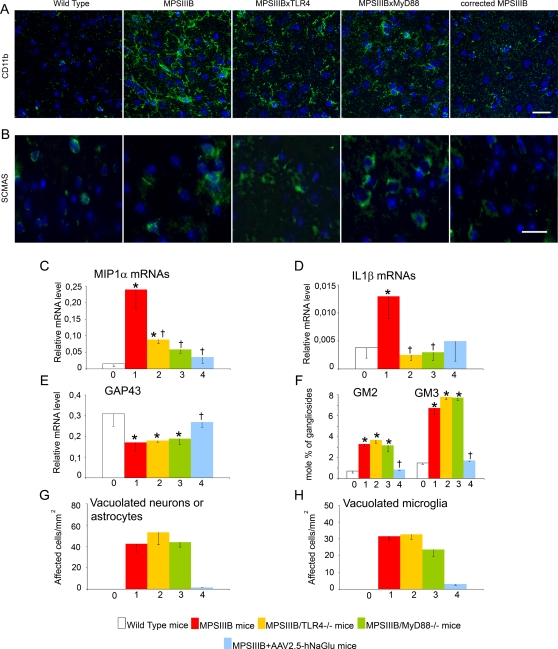
Methodology/principal findings: In cell culture, heparan sulfate oligosaccharides activated microglial cells by signaling through the Toll-like receptor 4 and the adaptor protein MyD88. CD11b positive microglial cells and three-fold increased expression of mRNAs coding for the chemokine MIP1alpha were observed at 10 days in the brain cortex of MPSIIIB mice, but not in MPSIIIB mice deleted for the expression of Toll-like receptor 4 or the adaptor protein MyD88, indicating early priming of microglial cells by heparan sulfate oligosaccharides in the MPSIIIB mouse brain. Whereas the onset of brain inflammation was delayed for several months in doubly mutant versus MPSIIIB mice, the onset of disease markers expression was unchanged, indicating similar progression of the neurodegenerative process in the absence of microglial cell priming by heparan sulfate oligosaccharides. In contrast to younger mice, inflammation in aged MPSIIIB mice was not affected by TLR4/MyD88 deficiency.

Conclusions/significance: These results indicate priming of microglia by HS oligosaccharides through the TLR4/MyD88 pathway. Although intrinsic to the disease, this phenomenon is not a major determinant of the neurodegenerative process. Inflammation may still contribute to neurodegeneration in late stages of the disease, albeit independent of TLR4/MyD88. The results support the view that neurodegeneration is primarily cell autonomous in this pediatric disease.


Conflict of interest statement

Competing Interests: The authors have declared that no competing interests exist.

Figures

Figure 1
Figure 1. Heparan sulfate oligosaccharides activate mouse microglial cells in vitro.
Microglial cell cultures were established from wild type (white bars), MPSIIIB (red bars), TLR4−/− (yellow bars), or MyD88−/− (green bars) mice. Cells were incubated for 4 hours with normal medium (mock), 5 µg/mL heparin (Hep), 5 µg/mL bovine heparan sulfate (bHS), 5 µg/mL of GAG purified from normal individual urine (nGAG), 1 µg/mL LPS (LPS), 5 µg/mL of heparan sulfate purified from the urines of two MPSIIIB patients (HS1 and HS2) or 10 µg/ml of polyinosine-polycytidylic acid (p[I∶C]). Normal mouse microglial activation is shown by increased amounts of TNFα, IL-1β, MIP1α mRNA production following incubation with LPS, HS1 or HS2. More robust responses of cells isolated from MPSIIIB mice is consistent with previous in vivo microglial priming, possibly by heparan sulfate. Lower expression by microglia from TLR4−/− or MyD88−/− mice indicates signaling through these molecules, whereas activation persisted upon stimulation by p[I∶C], which binds TLR3. Total RNA was extracted, reverse transcribed and amounts of cDNAs coding for TNFα, IL-1ß, MIP1α, or the reference protein ARPO were measured by Q-PCR. Indicated values are means±SEM of ratios of TNFα, IL-1ß, MIP1α mRNAs to ARPO mRNAs measured in three independent experiments.
Figure 2
Figure 2. GAG accumulate in the brain of MPSIIIB mice.
Wild type mice (0, white bars), MPSIIIB mice (1, red bars), MPSIIIB×TLR4−/− mice (2, yellow bars), MPSIIIB×MyD88−/− mice (3, green bars), or MPSIIIB mice in which the genetic defect was corrected in the brain by a single intracerebral injection of AAV2.5-hNaGlu vector (4, blue bars) were analyzed at the age of 10 days, 3 months, or 8 months. GAG concentration was determined in cortical tissue extracts. Values are means±SEM. Asterisks indicate significant difference with wild type mouse values, crosses indicate significant difference with MPSIIIB values (p<0.05, Mann and Whitney test).
Figure 3
Figure 3. Microglial cell activation and pathology markers in the brain at 10 days.
Wild type mice (0, white bars), MPSIIIB mice (1, red bars), MPSIIIB×TLR4−/− mice (2, yellow bars), MPSIIIB×MyD88−/− mice (3, green bars) were analyzed at the age of 10 days. Inflammation markers were studied in cortical samples stained with anti-CD11b antibody (green in A) and by measuring the relative amounts of MIP1α (C) and IL1ß (D) mRNAs by quantitative RT-PCR. Disease markers were studied in cortical samples stained with the anti-ScMAS antibody (green in B), and by measuring the relative amounts of GAP43 mRNAs (E) and the accumulation of GM2/GM3 gangliosides (F). Immunofluorescence (A and B): nuclei are stained in blue with Hoescht, scale bars: 20 µm for CD11b, 50 µm for ScMAS. Representative pictures from 3 MPSIIIB, 3 MPSIIIB×TLR4−/− and 3 MPSIIIB×MyD88−/− examined mice. RT-Q-PCR (C, D, E): mRNA amounts are expressed relative to the reference ARPO mRNA . Asterisks indicate significant difference with wild type mice and crosses indicate significant differences with untreated MPSIIIB mice (p<0.05, Mann and Whitney non-parametric test). Number of mice used for GAG, gangliosides and mRNA analyses: wild type mice, n = 6; MPSIIIB mice, n = 6; MPSIIIB×TLR4−/− mice, n = 5; MPSIIIB×MyD88−/− mice, n = 2.
Figure 4
Figure 4. Microglial cell activation and pathology markers in the brain at 3 months.
Wild type mice (0, white bars), MPSIIIB mice (1, red bars), MPSIIIB×TLR4−/− mice (2, yellow bars), MPSIIIB×MyD88−/− mice (3, green bars), or MPSIIIB mice in which the genetic defect was corrected in the brain by a single intracerebral injection of AAV2.5-hNaGlu vector (4, blue bars) were analyzed at the age of 3 months. Inflammation markers were studied in cortical samples stained with anti-CD11b antibody (green in A) and by measuring the relative amounts of MIP1α (C) and IL1ß (D) mRNAs by quantitative RT-PCR. Disease markers were studied in cortical samples stained with the anti-ScMAS antibody (green in B), and by measuring the relative amounts of GAP43 mRNAs (E), the accumulation of GM2/GM3 gangliosides (F), and the frequencies of vacuolated neurons or astrocytes (G) and vacuolated microglia in cortical semi-thin sections (H). Immunofluorescence (A and B): nuclei are stained in blue with Hoescht, scale bars: 20 µm for CD11b, 50 µm for ScMAS. Representative pictures from 3 MPSIIIB, 3 MPSIIIB×TLR4−/− and 3 MPSIIIB×MyD88−/− mice. RT-Q-PCR (C, D, E): mRNA amounts are expressed relative to the reference ARPO mRNA . Pathology (G and H): semi-thin sections (1 µm) were stained with toluidin blue. At least 90 neurons/astrocytes were scored per mm2 section surface. Values are from 3 MPSIIIB, 3 MPSIIIB×TLR4−/− and 3 MPSIIIB×MyD88−/− examined mice. Examples of the morphology of cells that were scored as normal neurons or astrocytes, or vacuolated neurons or astrocytes are illustrated in figure S4. Asterisks indicate significant difference with wild type mice and crosses indicate significant differences with untreated MPSIIIB mice (p<0.05, Mann and Whitney non-parametric test). Number of mice used for GAG, gangliosides and mRNA analyses: wild type mice, n = 7; MPSIIIB mice, n = 10; MPSIIIB×TLR4−/− mice, n = 3; MPSIIIB×MyD88−/− mice, n = 3; MPSIIIB+AAV2.5-hNaGlu mice, n = 3.
Figure 5
Figure 5. Microglial cell activation and pathology markers in the brain at 8 months.
Wild type mice (0, white bars), MPSIIIB mice (1, red bars), MPSIIIB×TLR4−/− mice (2, yellow bars), MPSIIIB×MyD88−/− mice (3, green bars), or MPSIIIB mice in which the genetic defect was corrected in the brain by a single intracerebral injection of AAV2.5-hNaGlu vector (4, blue bars) were analyzed at the age of 8 months. Inflammation markers were studied in cortical samples stained with anti-CD11b antibody (green in A) and by measuring the relative amounts of MIP1α (C) and IL1ß (D) mRNAs by quantitative RT-PCR. Disease markers were studied in cortical samples stained with the anti-ScMAS antibody (green in B), and by measuring the relative amounts of GAP43 mRNAs (E), the accumulation of GM2/GM3 gangliosides (F), and the frequencies of vacuolated neurons or astrocytes (G) and vacuolated microglia (H). Immunofluorescence (A and B): nuclei are stained in blue with Hoescht, scale bars: 20 µm for CD11b, 50 µm for ScMAS. Representative pictures from 3 MPSIIIB, 3 MPSIIIB×TLR4−/− and 3 MPSIIIB×MyD88−/− mice. RT-Q-PCR (C, D, E): mRNA amounts are expressed relative to the reference ARPO mRNA . Pathology (G and H): semi-thin sections (1 µm) were stained with toluidin blue. At least 90 neurons/astrocytes were scored per mm2 section surface. Values are from 3 MPSIIIB, 3 MPSIIIB×TLR4−/− and 3 MPSIIIB×MyD88−/− examined mice. Examples of the morphology of cells that were scored as normal neurons or astrocytes, or vacuolated neurons or astrocytes are illustrated in figure S4. Asterisks indicate significant difference with wild type mice and crosses indicate significant differences with untreated MPSIIIB mice (p<0.05, Mann and Whitney non-parametric test). Number of mice used for GAG, gangliosides and mRNA analyses: wild type mice, n = 5; MPSIIIB mice, n = 10; MPSIIIB×TLR4−/− mice, n = 4; MPSIIIB×MyD88−/− mice, n = 1; MPSIIIB+AAV2.5-hNaGlu mice, n = 3.

Similar articles

Cited by

References

    1. Bamberger ME, Harris ME, McDonald DR, Husemann J, Landreth GE. A cell surface receptor complex for fibrillar beta-amyloid mediates microglial activation. J Neurosci. 2003;23:2665–2674. - PMC - PubMed
    1. Zhang W, Wang T, Pei Z, Miller DS, Wu X, et al. Aggregated alpha-synuclein activates microglia: a process leading to disease progression in Parkinson's disease. Faseb J. 2005;19:533–542. - PubMed
    1. Wilms H, Rosenstiel P, Sievers J, Deuschl G, Zecca L, et al. Activation of microglia by human neuromelanin is NF-kappaB dependent and involves p38 mitogen-activated protein kinase: implications for Parkinson's disease. Faseb J. 2003;17:500–502. - PubMed
    1. Cunningham C, Deacon RM, Chan K, Boche D, Rawlins JN, et al. Neuropathologically distinct prion strains give rise to similar temporal profiles of behavioral deficits. Neurobiol Dis. 2005;18:258–269. - PubMed
    1. Moisse K, Strong MJ. Innate immunity in amyotrophic lateral sclerosis. Biochim Biophys Acta. 2006;1762:1083–1093. - PubMed

Publication types