Randomized Controlled Trial
. 2008 Aug;466(8):1978-86.
doi: 10.1007/s11999-008-0287-3. Epub 2008 May 29.

Accuracy of model-based RSA contour reduction in a typical clinical application

Affiliations
Randomized Controlled Trial

Accuracy of model-based RSA contour reduction in a typical clinical application

Christof Hurschler et al. Clin Orthop Relat Res. 2008 Aug.

Abstract

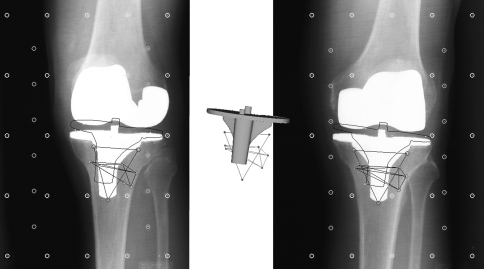
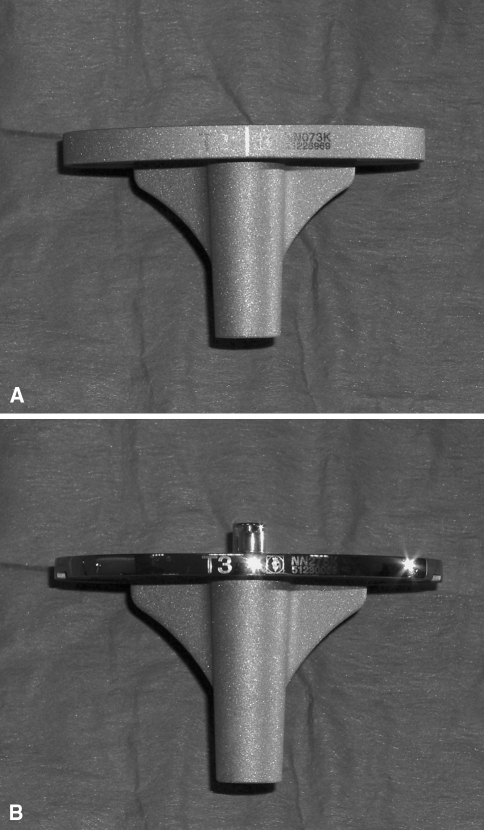
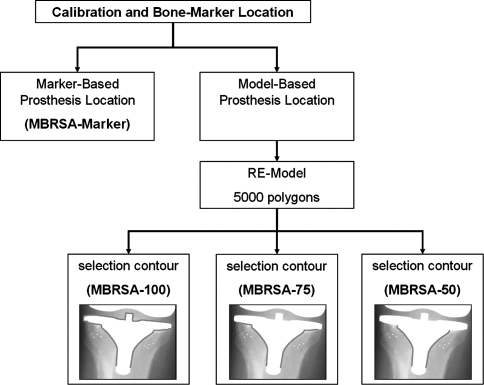
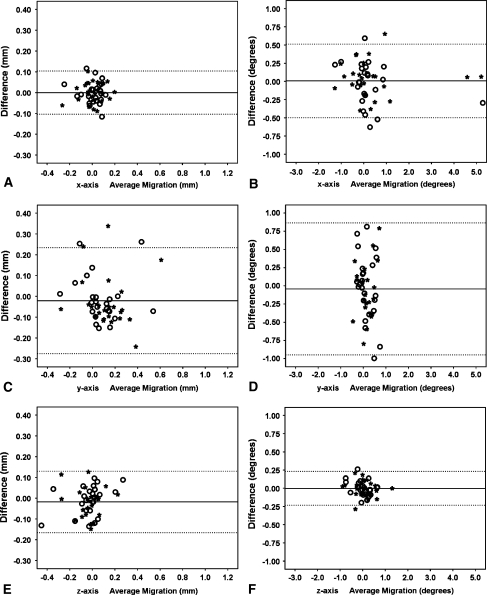
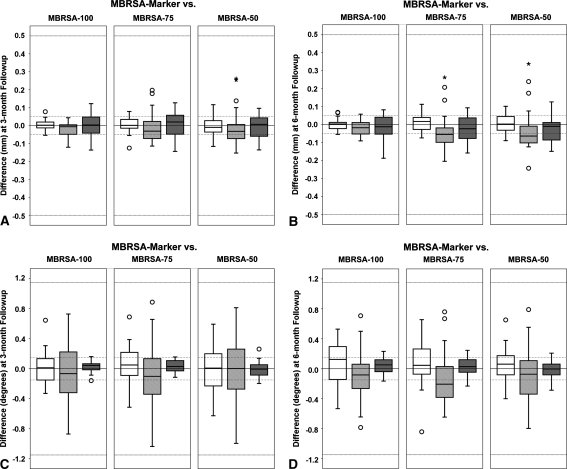
Marker-based roentgen stereophotogrammetric analysis (RSA) is an accurate method for measuring in vivo implant migration, which requires attachment of tantalum markers to the implant. Model-based RSA allows migration measurement without implant markers; digital pose estimation, which can be thought of as casting a shadow of a surface model of the implant into the stereoradiographs, is used instead. The number of surface models required in a given clinical study depends on the number of implanted sizes and design variations of prostheses. Contour selection can be used to limit pose estimation to areas of the prosthesis that do not vary with design, reducing the number of surface models required. The effect of contour reduction on the accuracy of the model-based method was investigated using three different contour selection schemes on tibial components in 24 patients at 3 and 6 month followup. The agreement interval (mean +/- 2 standard deviations), which bounds the differences between the marker-based and model-based methods with contour reduction was smaller than -0.028 +/- 0.254 mm. The data suggest that contour reduction does not result in unacceptable loss of model-based RSA accuracy, and that the model-based method can be used interchangeably with the marker-based method for measuring tibial component migration.


Figures

Fig. 1
Fig. 1
A typical view of an analysis using model-based and marker-based RSA (MBRSA 2.0 beta; Medis specials bv) is shown. The bone markers representing the reference rigid body for migration calculation are visible in circles. Three prosthesis markers also are visible, as is the geometric model of the prosthesis (foreground, middle). The projected contour of the implant (skewed), and the contour of the implant in the radiographs are visible (left and right), as are the fiducial and control markers used for calibration.
Fig. 2A–B
Fig. 2A–B
The photographs illustrate the (A) fixed-bearing and (B) rotational mobile-bearing implants investigated (Columbus® Knee System; Aesculap AG & Co KG). Both implants have the same geometry in the lower portion of the tibial plateau.
Fig. 3
Fig. 3
A schematic diagram shows each of the four analyses performed: one marker-based analysis (MBRSA-marker) and three different model-based analyses with different degrees of contour reduction (MBRSA-100, MBRSA-75, and MBRSA-50). RE = reverse engineering.
Fig. 4A–F
Fig. 4A–F
Scatterplots are shown for the MBRSA-marker versus MBRSA-50 migration in (A) mediolateral, (C) superoinferior, and (E) anteroposterior translation and rotation about the (B) mediolateral, (D) superoinferior, and (F) anteroposterior axes. Three-month (circles) and 6-month (stars) followup results are shown; each point represents the difference plotted versus the mean difference on the abscissa and ordinate, respectively, of migration computed with the two methods from the same image pair (n = 24). The solid horizontal line represents the mean of all the differences plotted, and the dashed lines represent the mean ± 2 standard deviations agreement interval. The plots show that the model-based method with contour reduction does not produce bias, and that the difference between the two methods (expressed by the agreement interval) is smaller than what we considered clinically relevant (±0.5 mm).
Fig. 5A–D
Fig. 5A–D
Box plots showing the calculated differences between the results of MBRSA-marker versus MBRSA-100, MBRSA-75, and MBRSA-50 along the mediolateral axis (white boxes), superoinferior axis (gray boxes), and anteroposterior axis (dark gray boxes). Translational motion at the (A) 3-month and (B) 6-month followups and rotational motion at the (C) 3-month and (D) 6-months followups are shown. The dashed horizontal lines indicate minimum (large dash gap) and maximum (small dash gap) ranges of RSA accuracy reported in the literature (95% CI); outliers (circles) and extreme values (stars) are also indicated. The box plots show that reducing the contour somewhat increases variability in the measurement of migration.

Similar articles

Cited by

References

    1. {'text': '', 'ref_index': 1, 'ids': [{'type': 'DOI', 'value': '10.1109/10.495283', 'is_inner': False, 'url': 'https://doi.org/10.1109/10.495283'}, {'type': 'PubMed', 'value': '8987268', 'is_inner': True, 'url': 'https://pubmed.ncbi.nlm.nih.gov/8987268/'}]}
    2. Banks SA, Hodge WA. Accurate measurement of three-dimensional knee replacement kinematics using single-plane fluoroscopy. IEEE Trans Biomed Eng. 1996;43:638–649. - PubMed
    1. {'text': '', 'ref_index': 1, 'ids': [{'type': 'DOI', 'value': '10.1302/0301-620X.81B2.8842', 'is_inner': False, 'url': 'https://doi.org/10.1302/0301-620x.81b2.8842'}, {'type': 'PubMed', 'value': '10204933', 'is_inner': True, 'url': 'https://pubmed.ncbi.nlm.nih.gov/10204933/'}]}
    2. Biedermann R, Krismer M, Stockl B, Mayrhofer P, Ornstein E, Franzen H. Accuracy of EBRA-FCA in the measurement of migration of femoral components of total hip replacement. Einzel-Bild-Rontgen-Analyse-femoral component analysis. J Bone Joint Surg Br. 1999;81:266–272. - PubMed
    1. {'text': '', 'ref_index': 1, 'ids': [{'type': 'PubMed', 'value': '2868172', 'is_inner': True, 'url': 'https://pubmed.ncbi.nlm.nih.gov/2868172/'}]}
    2. Bland JM, Altman DG. Statistical methods for assessing agreement between two methods of clinical measurement. Lancet. 1986;1:307–310. - PubMed
    1. {'text': '', 'ref_index': 1, 'ids': [{'type': 'DOI', 'value': '10.1016/j.jbiomech.2005.05.004', 'is_inner': False, 'url': 'https://doi.org/10.1016/j.jbiomech.2005.05.004'}, {'type': 'PubMed', 'value': '15990104', 'is_inner': True, 'url': 'https://pubmed.ncbi.nlm.nih.gov/15990104/'}]}
    2. Borlin N, Rohrl SM, Bragdon CR. RSA wear measurements with or without markers in total hip arthroplasty. J Biomech. 2006;39:1641–1650. - PubMed
    1. {'text': '', 'ref_index': 1, 'ids': [{'type': 'PubMed', 'value': '8175848', 'is_inner': True, 'url': 'https://pubmed.ncbi.nlm.nih.gov/8175848/'}]}
    2. Freeman MA, Plante-Bordeneuve P. Early migration and late aseptic failure of proximal femoral prostheses. J Bone Joint Surg Br. 1994;76:432–438. - PubMed

Publication types