. 2008 May 30;133(5):903-15.
doi: 10.1016/j.cell.2008.04.035.

The microRNA miR-1 regulates a MEF-2-dependent retrograde signal at neuromuscular junctions

Affiliations

The microRNA miR-1 regulates a MEF-2-dependent retrograde signal at neuromuscular junctions

David J Simon et al. Cell. .

Abstract

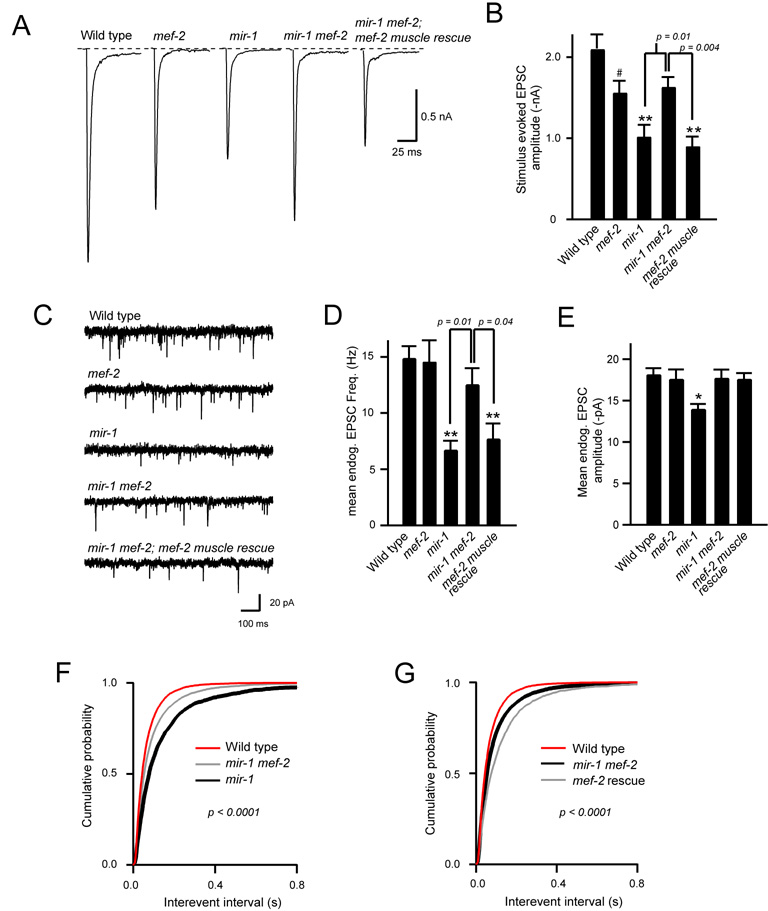
We show that miR-1, a conserved muscle-specific microRNA, regulates aspects of both pre- and postsynaptic function at C. elegans neuromuscular junctions. miR-1 regulates the expression level of two nicotinic acetylcholine receptor (nAChR) subunits (UNC-29 and UNC-63), thereby altering muscle sensitivity to acetylcholine (ACh). miR-1 also regulates the muscle transcription factor MEF-2, which results in altered presynaptic ACh secretion, suggesting that MEF-2 activity in muscles controls a retrograde signal. The effect of the MEF-2-dependent retrograde signal on secretion is mediated by the synaptic vesicle protein RAB-3. Finally, acute activation of levamisole-sensitive nAChRs stimulates MEF-2-dependent transcriptional responses and induces the MEF-2-dependent retrograde signal. We propose that miR-1 refines synaptic function by coupling changes in muscle activity to changes in presynaptic function.


Figures

Figure 1
Figure 1
miR-1 affects muscle sensitivity to ACh. A) A transcriptional reporter containing a 3.7kb mir-1 promoter driving expression of GFP showed expression in body-wall and pharyngeal muscles. B) Body-wall muscle expresses two classes of nAChR: the ACR-16/α7 homo-pentamers and the levamisole sensitive hetero-pentamer containing UNC-29. The ACR-16 receptor is activated by ACh while the UNC-29 receptor is activated by both ACh and levamisole (Lev). C) The time course of levamisole (0.2 mM)-induced paralysis of Wild type and mir-1(gk276) was compared. D–E) Levamisole (100 µM, 0.5 s)-evoked currents in body muscles were compared in Wild type (n=18), unc-29(x29) (n=3), mir-1(gk276) (n=9). Averaged traces (D) and peak amplitudes (E) are shown. F–G) Acetylcholine (500 µM, 0.5 s)-evoked currents in body muscles were compared in unc-29 and mir-1 unc-29 mutants. Averaged traces (F) and peak amplitudes (G) are shown. (*) indicates changes that are significantly different (p<0.01, Mann-Whitney) from control strains. Error bars indicate standard error of the mean. The mean endogenous EPSC amplitudes (H) and cumulative probability distributions of endogenous EPSC amplitudes (I) and decay taus (J) for mir-1 and wild type controls are compared. K) Average endogenous EPSCs are shown for Wild type (black), mir-1(red) and a scaled version of mir-1 (blue).
Figure 2
Figure 2
miR-1 regulates nAChR subunit abundance. A) Sequence alignment of miR-1 binding sites (predicted using the Miranda algorithm) in the unc-29 and unc-63 3’UTRs (Enright et al., 2003). (B–F) Abundance of endogenous UNC-29, UNC-38, and UNC-63 in wild-type (n=6) and mir-1 mutants (n=6) was compared by immunofluorescence (B–D) and immunoblotting (E, F). Scale bar indicates 10 µm. G–H) GFP abundance in body muscles was measured in transgenic animals expressing constructs containing either a wild-type (WT) (n=6) or mutagenized (3xMut) unc-29 3’UTR (n=6), or the unc-38 3’UTR (n=6). In unc-29 (3xMut), the sequence of the three miR-1 binding sites was scrambled (detailed in the methods). (*) indicates changes that are significantly different (p<0.01, Mann-Whitney) from control strains. Error bars indicate standard error of the mean.
Figure 3
Figure 3
Over-expression of UNC-29 and UNC-63 decreases sensitivity to levamisole. A) The time course of levamisole (0.2 mM)-induced paralysis was compared for wild-type, mir-1(gk276), and transgenic animals over-expressing UNC-29 [unc-29(xs)], UNC-63 [unc-63(xs)], or both [unc-29(xs);unc-63(xs)]. Data shown for Wild type and mir-1(gk276) are taken from Figure 1C. B–C) Levamisole (100 µM, 0.5 s)-evoked currents in body muscles were compared in wild-type (n=5) or transgenic animals over-expressing both unc-29 and unc-63 [unc-29(xs);unc-63(xs)] (n=6). Averaged traces (B) and peak amplitudes (C) are shown. (#) indicates changes that are significantly different (p<0.05, Mann-Whitney) from control strains. Error bars indicate standard error of the mean.
Figure 4
Figure 4
Decreased pre-synaptic ACh secretion in mir-1 mutants. Stimulus evoked responses were recorded from adult body wall muscles in 1mM CaCl2, 4 mM MgCl2. Average stimulus evoked responses (A) and EPSC amplitudes (B) are compared for Wild type (n=18) and mir-1(gk276) (n=18) animals. For stimulus-evoked responses here and in subsequent figures, approximately 2 ms, encompassing the stimulus artifact, was blanked for clarity. Traces containing stimulus artifacts are presented in Supplementary Figure 9. C) The time course of aldicarb (1 mM)-induced paralysis was compared for wild-type and mir-1(gk276). D–F) Sucrose evoked EPSCs were recorded from Wild type (n=6) and mir-1 (n=6) mutants. Representative sucrose responses (D), mean sucrose evoked charge transfer (1 second period after the stimulus) (E), and mean sucrose evoked quanta (F) are compared. Sucrose evoked quanta were computed by dividing the sucrose evoked charge transfer by the average endogenous EPSC charge transfer. G–I) Endogenous EPSCs were recorded from wild-type and mir-1 adult animals. Representative traces (G), mean endogenous EPSC rates (H), and cumulative probability distributions for the interevent intervals (I) are shown. (**) indicates a significant difference (p<0.0001, Student’s t-test) from Wild type.
Figure 5
Figure 5
MEF-2 mediates the pre-synaptic effects of miR-1. (A,B) Stimulus evoked responses were recorded from wild-type (n=18), mef-2(gv1) (n=8), mir-1(gk276) (n=18), mir-1 mef-2 (n=9), and mir-1 mef-2 double mutants carrying a transgene driving mef-2 expression in body muscles (mef-2 muscle rescue, n=6). Averaged responses (A) and mean EPSC amplitudes (B) are shown. C–G) Endogenous EPSCs were recorded from wild-type (n=18), mef-2(gv1) (n=9), mir-1(gk276) (n=18), mir-1 mef-2 (n=9), and mir-1 mef-2; mef-2 muscle rescue (n=6). The mean frequency (D), amplitude (E), and cumulative probability distributions of inter-event intervals (F,G) are shown. Values that differ significantly from wild-type controls are indicated: (*) p<0.01, (**) p<0.001, (#) p<0.05, Student’s t-test. Error bars indicate standard error of the mean.
Figure 6
Figure 6
RAB-3 is the pre-synaptic effector of the MEF-2-dependent retrograde message. A–E) YFP-tagged RAB-3 (YFP::RAB-3) was expressed in the cholinergic DA motor neurons (using the unc-129 promoter) in the indicated genotypes. Scale bars indicate 10 µm. F) RAB-3 punctal fluorescence was compared in wild-type (n=50), mef-2(gv1) (n=65), mir-1(gk276) (n=51), mir-1 mef-2 (n=34), and mir-1 mef-2 double mutants with mef-2 muscle rescue (n=29). Values that differ significantly from wild-type controls are indicated: (*) p<0.01, (**) p<0.001, Student’s t-test. G–H) Stimulus evoked responses were recorded from Wild type (n=18), mir-1(gk276) (n=18), rab-3(js49) (n=8) and mir-1; rab-3 (n=6). Averaged responses (G) and EPSC amplitudes (H) are shown. I–L) Endogenous EPSCs were recorded from Wild type (n=18), mir-1(gk276) (n=18), rab-3(js49) (n=8) and mir-1; rab-3 (n=6). Representative traces (I), endogenous EPSC frequencies (J), and amplitudes (K), and cumulative probability distributions of inter-event intervals are shown for the indicated genotypes. Values that differ significantly from wild-type controls are indicated: (*) p<0.01, (**) p<0.001, Mann-Whitney.
Figure 7
Figure 7
Acute activation of LevRs initiates MEF-2-dependent changes in transcription and a retrograde change in YFP::RAB-3. After 1 hour, Levamisole (200µM) and mock treated animals were subjected to RNA extraction or imaging. A) Expression of frm-4 was measured by qPCR (n=6 for Wild type and mef-2; n=3 for unc-29). Values that differ significantly from controls are indicated: (#) p<0.05, (*) p<0.01, Mann-Whitney. B–I) YFP::RAB-3 in the DA neurons is shown for the indicated genotypes. Scale bars indicate 10 µm. J) Average RAB-3 punctal fluorescence was compared in wild-type (n=25 mock, n=18 lev.), unc-29(x29) (n=16 mock, n=18 lev.), mef-2(gv1) (n=20 mock, n=16 lev.), and mef-2 muscle rescue (n=12 mock, n=17 lev.). (K–O) unc-29 mutations suppress the accumulation of YFP::RAB-3 in mir-1 mutants. YFP::RAB-3 punctal fluorescence is shown in the indicated genotypes. O) Average RAB-3 punctal fluorescence was compared in wild-type, unc-29(x29), mir-1(gk276) and mir-1 unc-29 double mutants [n=30 WT. n=26 mir-1, n=31 unc-29, n=35 mir-1 unc-29]. Values that differ significantly from wild-type controls are indicated: (**) p<0.001, Student’s t-test. (P - Q) Nicotine treatment did not alter RAB-3 fluorescence in WT. Q) RAB-3 punctal fluorescence was compared in nicotine treated and control animals [n=33 mock, n=33 nic.]. R) A model for miR-1 regulation of the MEF-2 dependent retrograde signal. miR-1 regulates muscle sensitivity to ACh by regulating the LevR and the magnitude of pre-synaptic release by regulating the activity of MEF-2. We suggest that mis-regulation of MEF-2 either initiates or modulates a retrograde signal that inhibits ACh release, most likely by decreasing the activity of RAB-3. Our data are consistent with miR-1/UNC-29/MEF-2 acting as part of a nicotinic signal transduction pathway to couple muscle activity to the generation of a retrograde signal that inhibits neurotransmitter release.

References

    1. Black B, Lu J, Olson E. The MEF2A 3′ untranslated region functions as a cis-acting translational repressor. Mol Cell Biol. 1997;17:2756–2763. - PMC - PubMed
    1. Brown LA, Jones AK, Buckingham SD, Mee CJ, Sattelle DB. Contributions from Caenorhabditis elegans functional genetics to antiparasitic drug target identification and validation: nicotinic acetylcholine receptors, a case study. Int J Parasitol. 2006;36:617–624. - PubMed
    1. Cao X, Yeo G, Muotri AR, Kuwabara T, Gage FH. NONCODING RNAS IN THE MAMMALIAN CENTRAL NERVOUS SYSTEM. Annual Review of Neuroscience. 2006;29:77–103. - PubMed
    1. Chen L, Krause M, Draper B, Weintraub H, Fire A. Body-wall muscle formation in Caenorhabditis elegans embryos that lack the MyoD homolog hlh-1. Science. 1992;256:240–243. - PubMed
    1. Davis GW, Bezprozvanny I. MAINTAINING THE STABILITY OF NEURAL FUNCTION: A Homeostatic Hypothesis. Annual Review of Physiology. 2001;63:847–869. - PubMed

Publication types

MeSH terms