. 2008 Jun 27;380(1):51-66.
doi: 10.1016/j.jmb.2008.03.076. Epub 2008 Apr 9.

Engineered bacterial outer membrane vesicles with enhanced functionality

Affiliations

Engineered bacterial outer membrane vesicles with enhanced functionality

Jae-Young Kim et al. J Mol Biol. .

Abstract

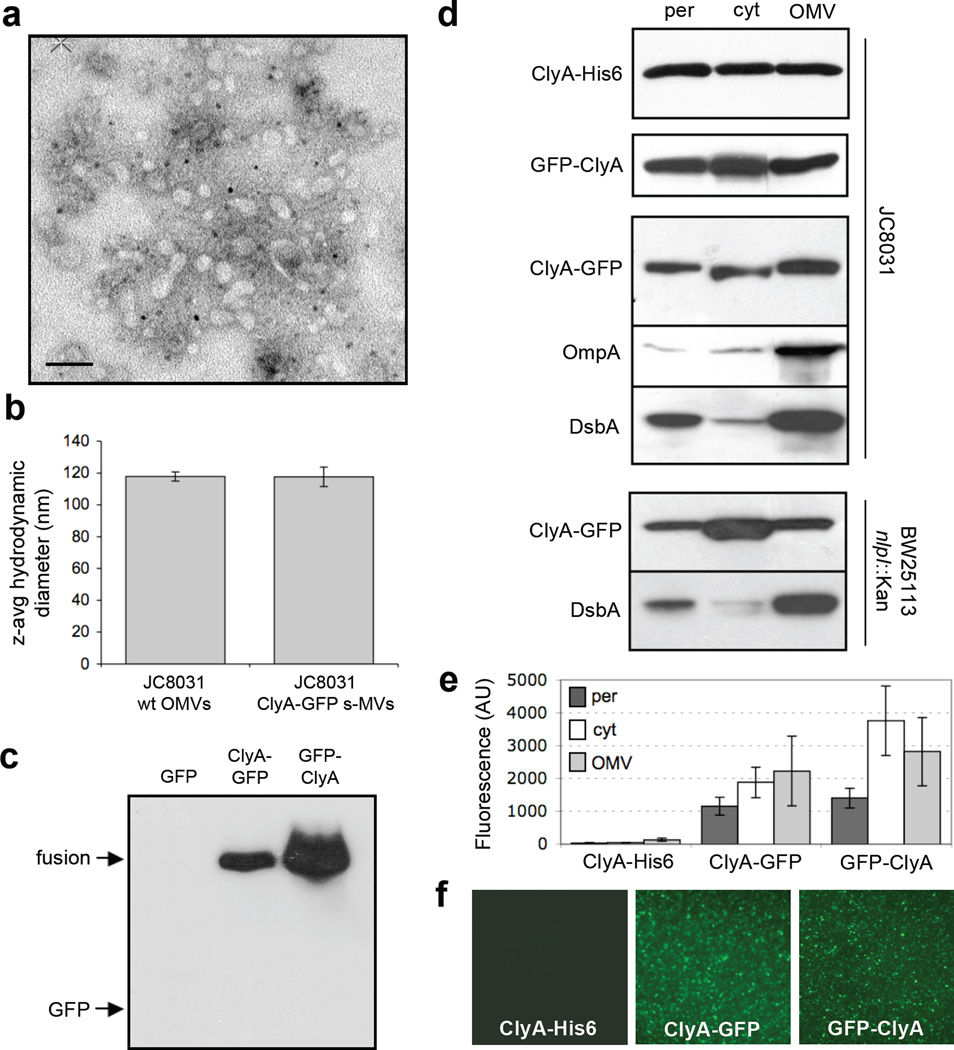
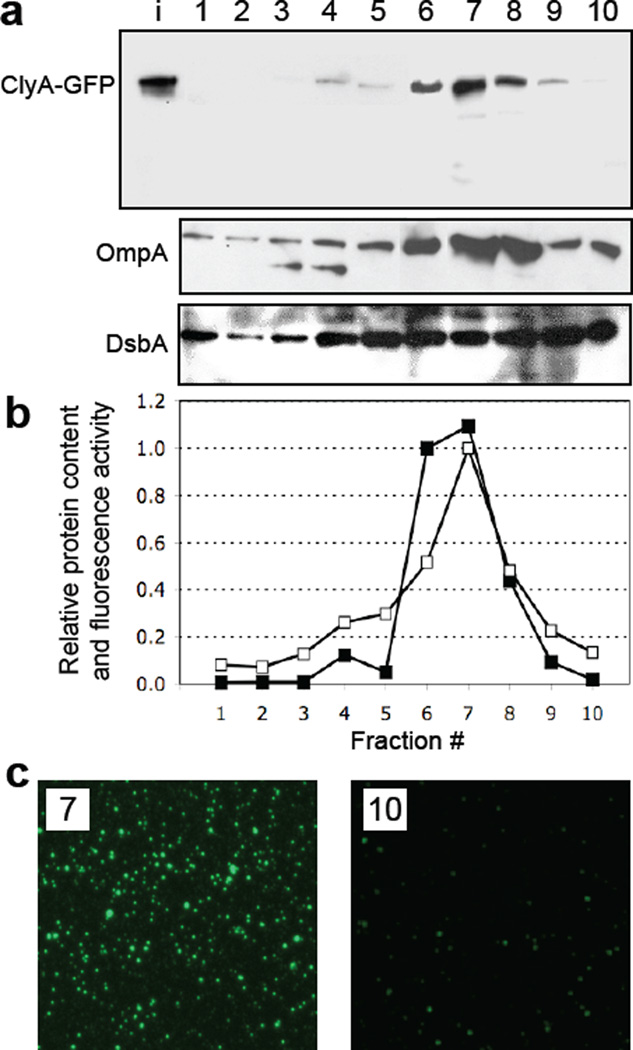
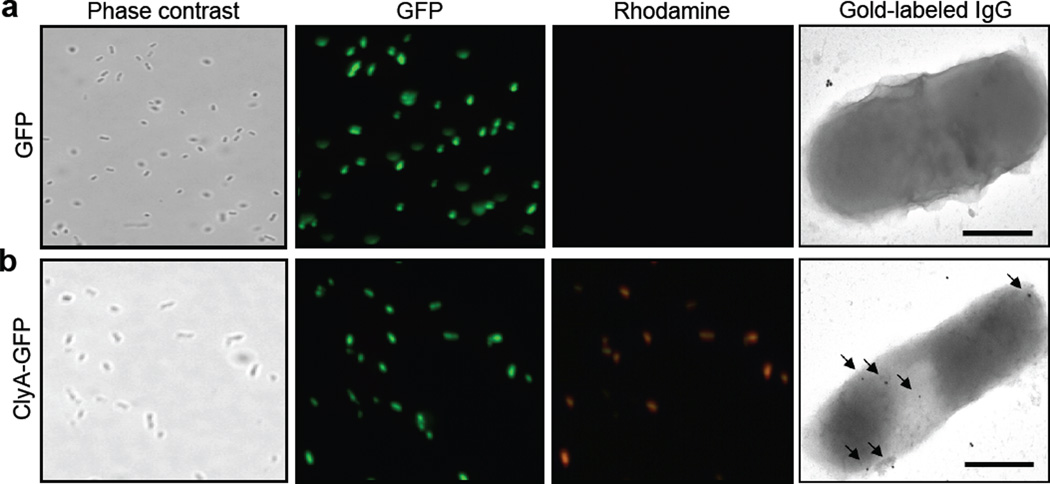
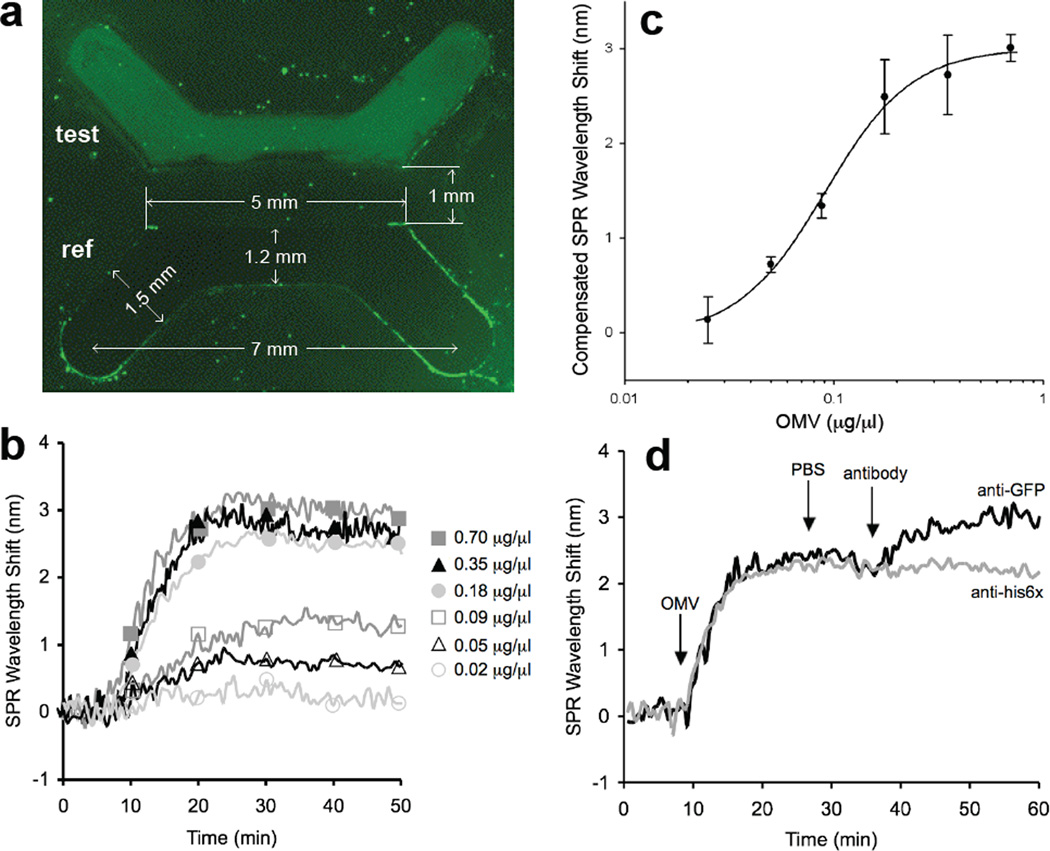
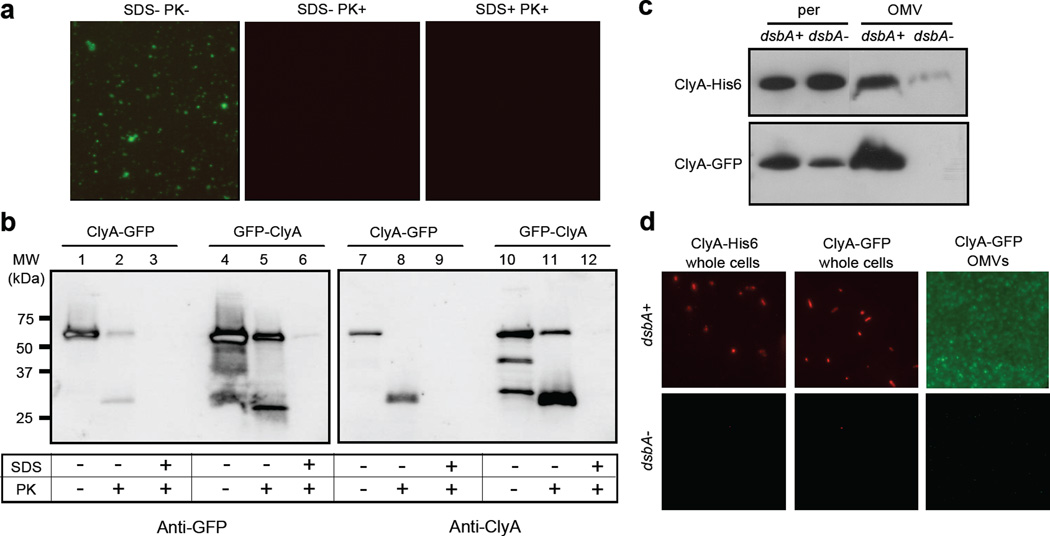
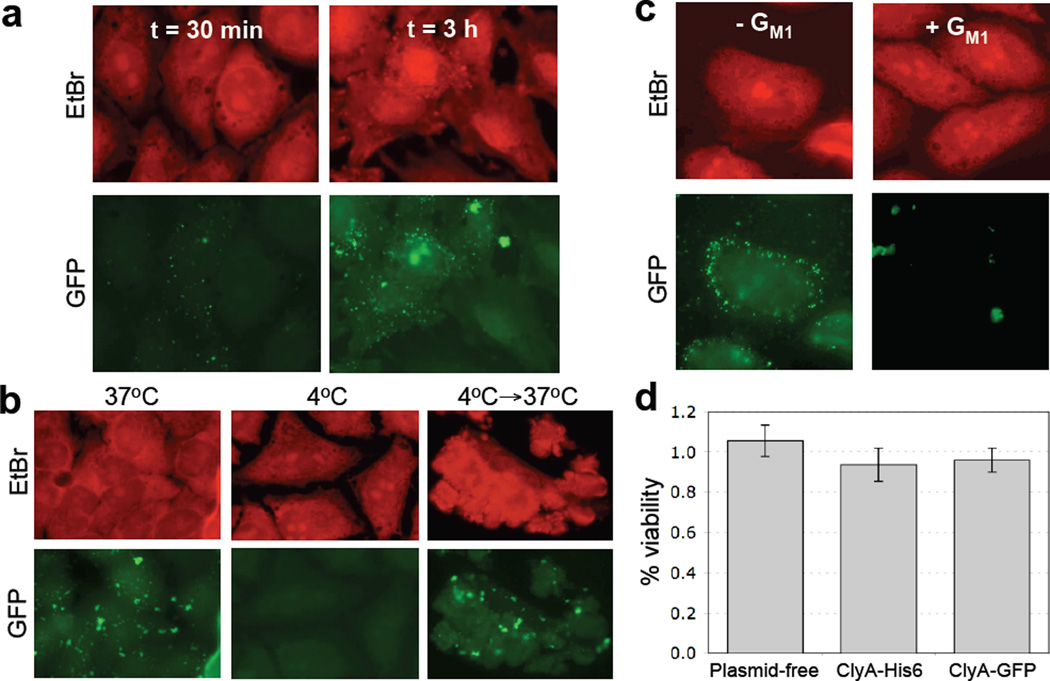
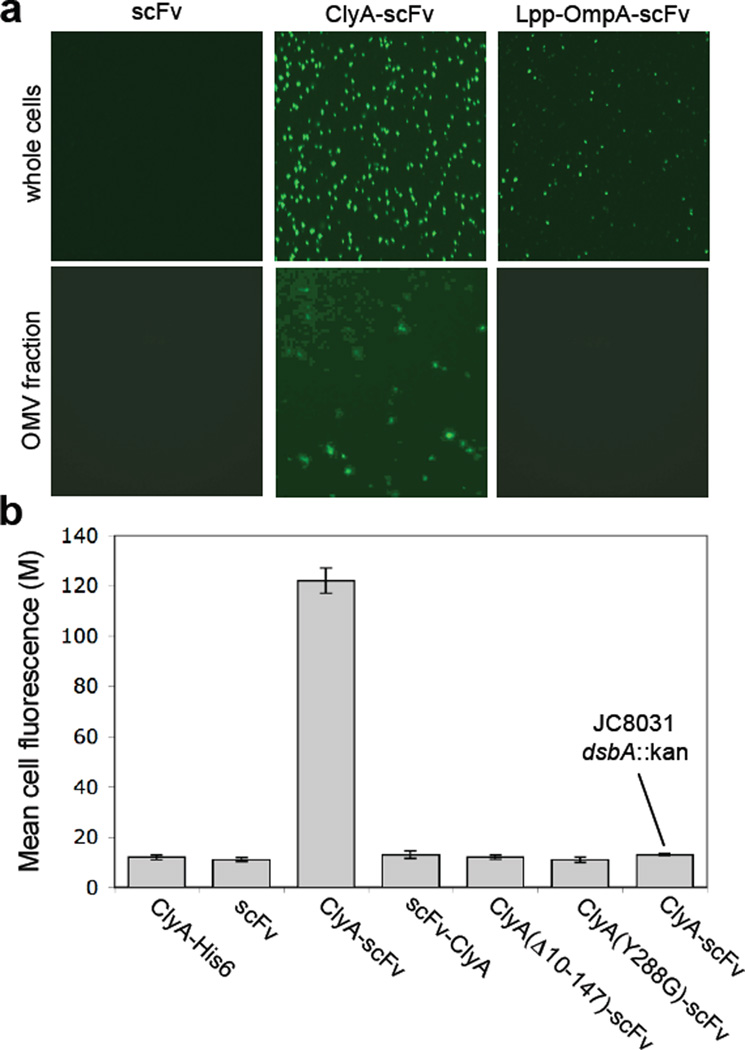
We have engineered bacterial outer membrane vesicles (OMVs) with dramatically enhanced functionality by fusing several heterologous proteins to the vesicle-associated toxin ClyA of Escherichia coli. Similar to native unfused ClyA, chimeric ClyA fusion proteins were found localized in bacterial OMVs and retained activity of the fusion partners, demonstrating for the first time that ClyA can be used to co-localize fully functional heterologous proteins directly in bacterial OMVs. For instance, fusions of ClyA to the enzymes beta-lactamase and organophosphorus hydrolase resulted in synthetic OMVs that were capable of hydrolyzing beta-lactam antibiotics and paraoxon, respectively. Similarly, expression of an anti-digoxin single-chain Fv antibody fragment fused to the C terminus of ClyA resulted in designer "immuno-MVs" that could bind tightly and specifically to the antibody's cognate antigen. Finally, OMVs displaying green fluorescent protein fused to the C terminus of ClyA were highly fluorescent and, as a result of this new functionality, could be easily tracked during vesicle interaction with human epithelial cells. We expect that the relative plasticity exhibited by ClyA as a fusion partner should prove useful for: (i) further mechanistic studies to identify the vesiculation machinery that regulates OMV secretion and to map the intracellular routing of ClyA-containing OMVs during invasion of host cells; and (ii) biotechnology applications such as surface display of proteins and delivery of biologics.


Figures

Figure 1
Figure 1
Subcellular localization of ClyA and ClyA fusions. (a) Electron micrograph of vesicles derived from JC8031 cells expressing ClyA-GFP. Bar is equal to 100 nm. (b) Z-average particle size of 1 ml vesicle suspensions containing ~30 µg/ml total protein obtained from plasmid-free or ClyA-GFP-expressing JC8031 cells. Error bars represent the standard deviation of 3 replicates. (c) Western blot of vesicle fractions isolated from E. coli strain JC8031 expressing GFP, ClyA-GFP and GFP-ClyA. Blot was probed with anti-GFP serum. (d) Western blot and (e) GFP fluorescence of periplasmic (per), cytoplasmic (cyt) and vesicle (OMV) fractions generated from JC8031 or BW25113 nlpI::Kan cells expressing ClyA-His6, ClyA-GFP and GFP-ClyA. ClyA-His6 blot was first probed with anti-polyhistidine. ClyA-GFP and GFP-ClyA blots were probed with anti-GFP. Following stripping of membranes, blots were reprobed with anti-OmpA serum or anti-DsbA serum as indicated. All fractions were generated from an equivalent number of cells. (f) Fluorescence microscopy of vesicles generated from JC8031 cells expressing ClyA-His6, ClyA-GFP and GFP-ClyA.
Figure 2
Figure 2
Density gradient fractionation of vesicles. (a) Electrophoretic analysis of the density gradient fractions from top (lane 1, lowest density) to bottom (lane 10, highest density) from JC8031 cells expressing ClyA-GFP. The bands corresponding to ClyA-GFP (top), OmpA (middle) and DsbA (bottom) were obtained with anti-GFP, anti-OmpA and anti-DsbA serum, respectively. Lane i represents input vesicles from the purified cell-free supernatant. (b) Quantification of the ClyA-GFP levels (filled squared) in each fraction as determined by densitometry using ImageJ software. Band intensity values were normalized to the maximum intensity corresponding to the ClyA-GFP measured in fraction 7. Also plotted is the GFP activity (open squares) measured in each fraction and normalized to the maximum activity, which also corresponded to fraction 7. (c) Fluorescence microscopy of vesicles that migrated in gradient fractions 7 and 10.
Figure 3
Figure 3
Microscopic analysis of ClyA expression. JC8031 cells grown at 37°C in LB were induced to express (a) GFP and (b) ClyA-GFP. For immunofluorescence microscopy, cells were treated with mouse monoclonal anti-GFP and subsequently with rhodamine-conjugated anti-mouse IgG. Panels show phase contrast microscopy and fluorescence microscopy using green and red emission filters as indicated. For immunoelectron microscopy, cells were treated with mouse monoclonal anti-GFP and subsequently with gold-conjugated anti-mouse IgG. Arrows indicate the 25 nm gold particles. The bars are equal to 500 nm.
Figure 4
Figure 4
Detection of vesicles and vesicle-associated antigens via immuno-SPR. (a) Fluorescence microscopy analysis of the binding of fluorescent s-MVs (at a concentration of 0.35 µg/µl) to anti-E. coli antibody in the test channel and to the BSA-treated surface in the reference channel following 20 min of s-MV binding and 20 min PBS rinse. The measurements indicated represent the size of the PDMS master. (b) Overlaid SPR sensorgrams showing concentration-dependent binding of OMVs to immobilized anti-E. coli antibodies. For each binding experiment, 200 µl of OMV-containing samples (diluted to the concentrations indicated) was introduced to the test or reference channel for 20 min, followed by a 20 min PBS rinse. The SPR signal was recorded as wavelength shift (nm) versus time and plotted as a “sensorgram”. All binding experiments were performed at 25°C ± 1°C with a flowrate of 10 µl/min. Each vesicle sample was assayed in triplicate and the standard error was determined to be less than 5%. (c) Vesicle standard curve generated using the SPR immunosensor. The steady-state SPR signal change was calculated by subtracting the average SPR signal during the PBS wash step following OMV binding from the average SPR signal collected during the initial PBS wash step prior to OMV addition. The equation y = 0.92ln(x) + 3.63 with an R2 value of 0.95 describes the fit of a straight line through the logarithm of the data and was determined using SigmaPlot. The results are the average of the values calculated for the SPR signal change from three independent binding measurements with error bars showing ± standard error. It is noteworthy that the lower detection limit for this system was determined to be 0.01 µg/µl (10% of the compensated SPR wavelength shift in the standard curve) and that for vesicle concentrations ≥0.18 µg/µl, SPR wavelength shifts >2.5 nm were recorded, which is ~10× greater than the baseline signal. (d) Representative sensorgrams for antibody binding to s-MV surface-displayed GFP in test and reference channels. Channels were prepared identically so that fluorescent s-MVs were captured in both channels. The change in SPR signal over time was measured following addition of 1 µg/µl anti-GFP (black line) or 1 µg/µl anti-his6× (gray line) monoclonal antibody to surface-captured s-MVs. Antibody binding proceeded for 20 min followed by a 10 min PBS rinse. Each antibody was assayed in triplicate and the standard error was determined to be less than 5%.
Figure 5
Figure 5
Biochemical and genetic analysis of ClyA localization. Proteinase K susceptibility of OMV-tethered GFP as determined by: (a) fluorescence microscopy of vesicles generated from JC8031 cells expressing ClyA-GFP treated with Proteinase K and SDS as indicated; and (b) Western blot of vesicles generated from JC8031 cells expressing ClyA-GFP or GFP-ClyA. Blots were probed with mouse anti-GFP (left panels) or anti-ClyA serum (right panels). Molecular weight (MW) ladder is marked at left. An equivalent number of vesicles was used in all cases. (c) Western blot analysis of periplasmic and OMV fractions from JC8031 (dsbA+) and JC8031 dsbA::Kan cells (dsbA-) expressing either ClyA-GFP or ClyA-His6 as indicated. (d) Immunofluorescence (left and center panels) of wt JC8031 (dsbA+, top) and JC8031 dsbA::Kan cells (dsbA-, bottom) expressing pClyA-GFP or pClyA-His6 as indicated and fluorescence (right panel) of vesicles derived from the same cells as indicated. For immunofluorescence, cells were treated with either mouse monoclonal anti-GFP or anti-polyhistidine antibodies and subsequently with rhodamine-conjugated anti-mouse IgG.
Figure 6
Figure 6
Interaction of ClyA-GFP vesicles with HeLa cells. (a) OMVs containing ClyA-GFP were incubated with HeLa cells at 37°C for 30 min or 3 h as indicated. Fixed cells were stained with 0.5 mg/mL ethidium bromide (EtBr, upper panels) and visualized by fluorescence microscopy. (b) Temperature dependence of OMV-HeLa cell interactions was examined by incubation of HeLa cells with GFP-ClyA OMVs at the temperatures indicated. An equivalent number of OMVs (~150 µg) was used in all cases. (c) Untreated (− GM1) or pretreated (+ GM1) OMVs from JC8031 cells expressing ClyA-GFP were incubated with HeLa cells at 37°C for 3 h. Fixed cells were stained with 0.5 mg/mL ethidium bromide (EtBr, upper panels) and visualized by fluorescence microscopy. An equivalent number of OMVs (~150 µg) was used in all cases. (d) Cytotoxicity of vesicles as measured using the MTS assay with HeLa cell cultures. % viability is reported as the viability of vesicle-treated HeLa cells normalized to the viability following treatment with PBS. HeLa cells were treated with vesicle solutions derived from plasmid-free JC8031 cells and JC8031 cells expressing ClyA-His6, ClyA-GFP (dark gray). An equivalent number of OMVs (~150 µg) was used in all cases. Each sample was assayed in triplicate with error bars showing ± standard error.
Figure 7
Figure 7
Creation of immuno-MVs via ClyA-scFv chimeras. (a) Fluorescence microscopy of whole cells and vesicles generated from JC8031 cells expressing scFv.Dig, ClyA-scFv.Dig or Lpp-OmpA-scFv.Dig as indicated. For these studies, cells were grown and induced at room temperature followed by fluorescent labeling of cells or their derived vesicles with 1 µM Dig-BODIPY for 1 h at room temperature. (b) Genetic analysis of scFv.Dig localization was performed using flow cytometric analysis of strains and plasmids as indicated. Cells were grown and induced at room temperature followed by labeling with 1 µM Dig-BODIPY for 1 h at room temperature. Fluorescence is reported as the mean fluorescence for each cell population and was assayed in triplicate with error bars showing ± standard error.

Similar articles

Cited by

References

    1. Christie PJ, Vogel JP. Bacterial type IV secretion: conjugation systems adapted to deliver effector molecules to host cells. Trends Microbiol. 2000;8:354–360. - PMC - PubMed
    1. Galan JE, Collmer A. Type III secretion machines: bacterial devices for protein delivery into host cells. Science. 1999;284:1322–1328. - PubMed
    1. Gentschev I, Dietrich G, Goebel W. The E. coli alpha-hemolysin secretion system and its use in vaccine development. Trends Microbiol. 2002;10:39–45. - PubMed
    1. Henderson IR, Cappello R, Nataro JP. Autotransporter proteins, evolution and redefining protein secretion. Trends Microbiol. 2000;8:529–532. - PubMed
    1. Russel M. Macromolecular assembly and secretion across the bacterial cell envelope: type II protein secretion systems. J Mol Biol. 1998;279:485–499. - PubMed

Publication types

MeSH terms

LinkOut - more resources