

Waist-to-hip ratio, body mass index, and subsequent kidney disease and death
- PMID: 18511168
- PMCID: PMC4052757
- DOI: 10.1053/j.ajkd.2008.02.363
Waist-to-hip ratio, body mass index, and subsequent kidney disease and death
Abstract
Background: Chronic kidney disease (CKD) and obesity are important public health concerns. We examined the association between anthropomorphic measures and incident CKD and mortality.
Study design: Cohort study.
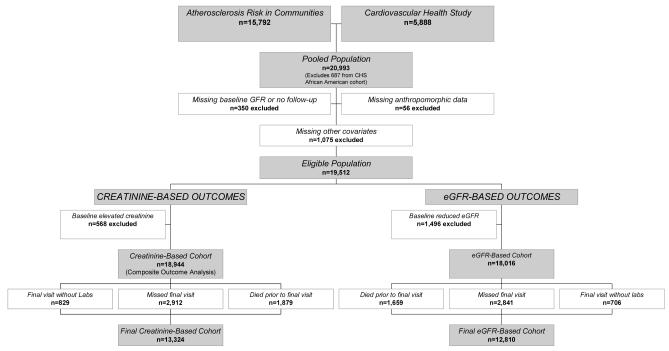
Setting & participants: Individual patient data pooled from the Atherosclerosis Risk in Communities Study and the Cardiovascular Health Study.
Predictors: Waist-to-hip ratio (WHR), body mass index (BMI).
Outcomes & measurements: Incident CKD defined as serum creatinine level increase greater than 0.4 mg/dL with baseline creatinine level of 1.4 mg/dL or less in men and 1.2 mg/dL or less in women and final creatinine level greater than these levels, and, in separate analyses, estimated glomerular filtration rate (eGFR) decrease of 15 mL/min/1.73 m(2) or greater with baseline eGFR of 60 mL/min/1.73 m(2) or greater and final eGFR less than 60 mL/min/1.73 m(2). Multivariable logistic regression to determine the association between WHR, BMI, and outcomes. Cox models to evaluate a secondary composite outcome of all-cause mortality and incident CKD.
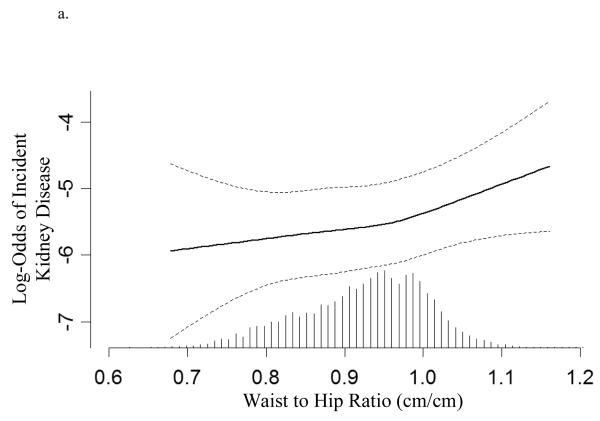
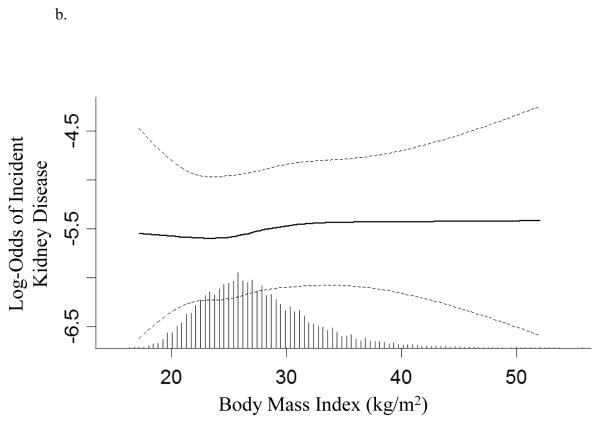
Results: Of 13,324 individuals, mean WHR was 0.96 in men and 0.89 in women and mean BMI was 27.2 kg/m(2) in both men and women. During 9.3 years, 300 patients (2.3%) in creatinine-based models and 710 patients (5.5%) in eGFR-based models developed CKD. In creatinine-based models, each SD increase in WHR was associated with increased risk of incident CKD (odds ratio, 1.22; 95% confidence interval [CI], 1.05 to 1.43) and the composite outcome (hazard ratio, 1.12; 95% CI, 1.06 to 1.18), whereas each SD increase in BMI was not associated with CKD (odds ratio, 1.05; 95% CI, 0.93 to 1.20) and appeared protective for the composite outcome (hazard ratio, 0.94; 95% CI, 0.90 to 0.99). Results of eGFR-based models were similar.
Limitations: Single measures of creatinine, no albuminuria data.
Conclusions: WHR, but not BMI, is associated with incident CKD and mortality. Assessment of CKD risk should use WHR rather than BMI as an anthropomorphic measure of obesity.
Figures
References
-
- Coresh J, Selvin E, Stevens LA, et al. Prevalence of Chronic Kidney Disease in the United States. JAMA. 2007;298:2038–2047. - PubMed
-
- Weiner DE, Tabatabai S, Tighiouart H, et al. Cardiovascular outcomes and all-cause mortality: exploring the interaction between CKD and cardiovascular disease. Am J Kidney Dis. 2006;48:392–401. - PubMed
-
- Ogden CL, Carroll MD, Curtin LR, McDowell MA, Tabak CJ, Flegal KM. Prevalence of overweight and obesity in the United States, 1999-2004. JAMA. 2006;295:1549–1555. - PubMed
-
- Hsu CY, McCulloch CE, Iribarren C, Darbinian J, Go AS. Body mass index and risk for end-stage renal disease. Ann Intern Med. 2006;144:21–28. - PubMed
-
- Iseki K, Ikemiya Y, Kinjo K, Inoue T, Iseki C, Takishita S. Body mass index and the risk of development of end-stage renal disease in a screened cohort. Kidney Int. 2004;65:1870–1876. - PubMed
Publication types
MeSH terms
Substances
Grants and funding
LinkOut - more resources
Full Text Sources
Medical
Research Materials
Miscellaneous
