. 2008 Aug;128(2):181-9.
doi: 10.1016/j.clim.2008.03.522. Epub 2008 Jun 3.

Monosomy 1p36 uncovers a role for OX40 in survival of activated CD4+ T cells

Affiliations

Monosomy 1p36 uncovers a role for OX40 in survival of activated CD4+ T cells

M M Suhoski et al. Clin Immunol. 2008 Aug.

Abstract

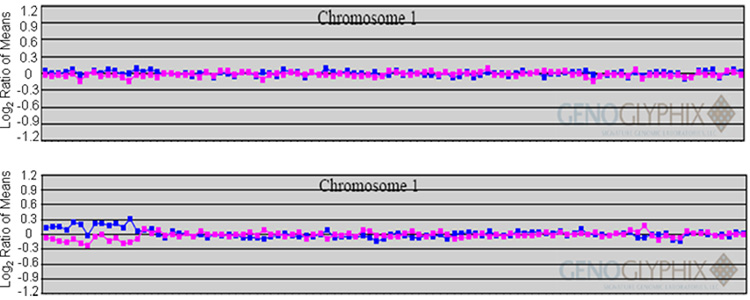
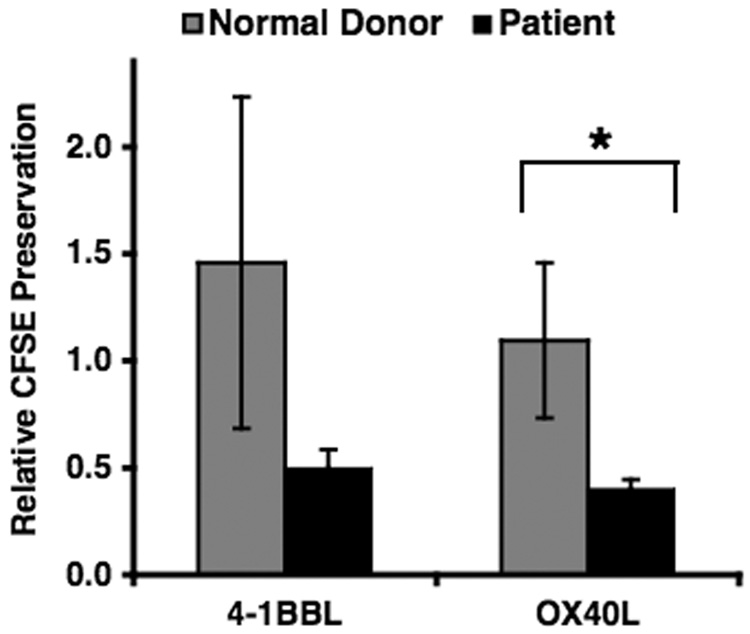
Monosomy 1p36 is a subtelomeric deletion syndrome associated with congenital anomalies presumably due to haploinsufficiency of multiple genes. Although immunodeficiency has not been reported, genes encoding costimulatory molecules of the TNF receptor superfamily (TNFRSF) are within 1p36 and may be affected. In one patient with monosomy 1p36, comparative genome hybridization and fluorescence in- situ hybridization confirmed that TNFRSF member OX40 was included within the subtelomeric deletion. T cells from this patient had decreased OX40 expression after stimulation. Specific, ex vivo T cell activation through OX40 revealed enhanced proliferation, and reduced viability of patient CD4+ T cells, providing evidence for the association of monosomy 1p36 with reduced OX40 expression, and decreased OX40-induced T cell survival. These results support a role for OX40 in human immunity, and calls attention to the potential for haploinsufficiency deletions of TNFRSF costimulatory molecules in monosomy 1p36.


Figures

Figure 1
Figure 1. FISH analysis and microarray profile define the 1p deletion
a. Map of chromosome 1p36 demonstrating the location of TNFRSF members and BAC probes used to define patient deletion. The deletion breakpoint is marked. b. FISH studies on metaphase spreads from the patient. (Left) Subtelomeric probes for 1p - CDB108/T7 labeled in green, and 1q - 1qtell9 labeled in red, reveal a deletion of the 1p probe. (Middle) BAC RP5-902P8 includes the OX40 locus and is present in only one copy of chromosome 1, demonstrating deletion of this locus. (Right) BAC RP4-758J18, which maps proximal to the OX40 locus, within 1p36 is present on both copies of 1p. c. Microarray profile for a mosaic, terminal deletion of 1p36 characterized by array CGH. Each clone represented on the array is arranged along the x-axis according to its location on the chromosome with the most distal/telomeric p-arm clones on the left and the most distal/telomeric q-arm clones on the right. The blue line plots represent the ratios from the first slide for each patient (control Cy5/patient Cy3) and the pink plots represent the ratios obtained from the second slide for each patient in which the dyes have been reversed (patient Cy5/control Cy3). Typical deletions show deviations greater than 0.3 and -0.3. (top) Plot for a normal chromosome 1 showing a ratio of 0 on a log2 scale for all clones. (bottom) Plot showing single-copy loss of 13 clones at 1p36.3 indicating a terminal deletion of 2.9Mb. Note that for most of the clones the deviations do not reach the expected 0.3 and -0.3 because of the presence of mosaicism.
Figure 2
Figure 2. Decreased expression of OX40 on patient PBMC compared to healthy control
PBMC from patient or normal donor control were stimulated with PHA and IL-2 overnight and surface expression was measured for CD40L, GITR and OX40. Histograms represent expression of these costimulatory receptors on patient CD4+ T cells (black) compared to isotype (gray) and normal donor control (heavy black).
Figure 3
Figure 3. Polyclonal stimulation of patient CD4 results in enhanced proliferation
Cryopreserved PBMCs from patient or normal donor control were thawed, labeled with CFSE and co-cultured with CD32 aAPCs alone (no stimulation) or loaded with anti-CD3 that were expressing costimulatory ligands 4-1BBL or OX40L. Proliferation was assessed by flow cytometry and data analyzed using FlowJo software. A. Overlay of histograms representing CFSE dilutions of CD4+ cells on day 6 in the culture. Experiment was conducted in duplicate, and gated on CD4+ T cells. B. Relative CFSE preservation index. MFI of CFSE for each of the cultures on day 6 of stimulation was used to calculate the relative preservation of CFSE expression as described in the materials and methods. Mean values obtained for patient CD4+ T cells (black) stimulated with anti-CD3 loaded K562 aAPCs expressing OX40L or 4-1BBL compared to 8 normal donors (gray). Error bars represent +/- standard deviation. A two-tailed student t-test was performed and p values (* <0.05) were considered statistically significant. Plots are representative of three independent experiments using patient PBMCs and normal donor controls.
Figure 4
Figure 4. Polyclonal stimulation of patient CD4 results in decreased viability
Cryopreserved PBMCs from patient or normal donor control were thawed and co-cultured with CD32 aAPCs alone (no stimulation) or loaded with anti-CD3 that were expressing costimulatory ligands 4-1BBL or OX40L. Decrease in viability of CD4+ cells from patient compared to healthy donor. Cell viability was measured on day 6 in culture using VIAPROBE (7-AAD). Experiment was conducted in duplicate. Viability was assessed using flow cytometry and analyzed using Flowjo software. Left: Histograms representing VIAPROBE (7-AAD) +/− expression in CD4+ T cells from normal donor control (top) and patient (bottom). Right: Mean percentages of VIAPROBE+ CD4+ T cells for patient (black) were calculated and compared to 8 normal donor controls (gray). Error bars represent +/− standard deviation. A two-tailed student t-test was performed, and those p values (* p < 0.05, ** p< 0.001) were considered statistically significant. Representative of at least three independent experiments.

References

    1. Heilstedt HA, Ballif BC, Howard LA, Lewis RA, Stal S, Kashork CD, Bacino CA, Shapira SK, Shaffer LG. Physical map of 1p36, placement of breakpoints in monosomy 1p36, and clinical characterization of the syndrome. American Journal of Human Genetics. 2003;72:1200–1212. - PMC - PubMed
    1. Shapria SK, McCaskill C, Northrup H, Spikes AS, Elder FFB, Sutton VR, Korenberg JR, Greenberg F, Shaffer LG. Chromosome 1p36 deletions: The clinical phenotype and molecular characterization of a common newly delineated syndrome. American Journal of Human Genetics. 1997;61:642–650. - PMC - PubMed
    1. Kurosawa K, Kawame H, Okamoto N, Ochiai Y, Akatsuka A, Kobayashi M, Shimohira M, Mizuno S, Wada K, Fukushima Y, Kawawaki H, Yamamoto T, Masuno M, Imaizumi K, Kuroki Y. Epilepsy and neurological findings in 11 individuals with 1p36 deletion syndrome. Brain & Development. 2005;27:378–382. - PubMed
    1. Gajecka M, Yu W, Ballif BC, Glotzbach CD, Bailey KA, Shaw CA, Kashork CD, Heilstedt HA, Ansel DA, Theisen A, Rice R, Rice DPC, Shaffer LG. Delineation of mechanisms and regions of dosage imbalance in complex rearrangements of 1p36 leads to a putative gene for regulation of cranial suture closure. European Journal of Human Genetics. 2005;13:139–149. - PubMed
    1. Neumann LM, Polster T, Spantzel T, Bartsch O. Unexpected death of a 12 year old boy with monosomy 1p36. Genetic Counseling. 2004;15:19–26. - PubMed

Publication types

Substances