. 2008 Sep;7(9):1702-13.
doi: 10.1074/mcp.M800029-MCP200. Epub 2008 May 29.

Robust and sensitive iTRAQ quantification on an LTQ Orbitrap mass spectrometer

Affiliations

Robust and sensitive iTRAQ quantification on an LTQ Orbitrap mass spectrometer

Marcus Bantscheff et al. Mol Cell Proteomics. 2008 Sep.

Abstract

Isobaric stable isotope tagging reagents such as tandem mass tags or isobaric tags for relative and absolute quantification enable multiplexed quantification of peptides via reporter ion signals in the low mass range of tandem mass spectra. Until recently, the poor recovery of low mass fragments observed in tandem mass spectra acquired on ion trap mass spectrometers precluded the use of these reagents on this widely available instrument platform. The Pulsed Q Dissociation (PQD) technique allows negotiating this limitation but suffers from poor fragmentation efficiency, which has raised doubts in the community as to its practical utility. Here we show that by carefully optimizing instrument parameters such as collision energy, activation Q, delay time, ion isolation width, number of microscans, and number of trapped ions, low m/z fragment ion intensities can be generated that enable accurate peptide quantification at the 100 amol level. Side by side comparison of PQD on an LTQ Orbitrap with CID on a five-year old Q-Tof Ultima using complex protein digests shows that whereas precision of quantification of 10-15% can be achieved by both approaches, PQD quantifies twice as many proteins. PQD on an LTQ Orbitrap also outperforms "higher energy collision induced dissociation" on the same instrument using the recently introduced octapole collision cell in terms of lower limit of quantification. Finally, we demonstrate the significant analytical potential of iTRAQ quantification using PQD on an LTQ Orbitrap by quantitatively measuring the kinase interaction profile of the small molecule drug imatinib in K-562 cells. This article gives practical guidance for the implementation of PQD, discusses its merits, and for the first time, compares its performance to higher energy collision-induced dissociation.


Figures

F<sc>ig</sc>. 1.
Fig. 1.
Optimization of PQD parameters using a mixture of iTRAQ 114- and iTRAQ 117-labeled FibA. A, B, and C, relative fragment ion intensity as a function of normalized collision energy (A), activation time at activation Q = 0.7 (B), and activation time at activation Q = 0.55 (C). iTRAQ reporter ions are shown as blue (114) and red lines (117); fragment ion intensities of the signals at m/z 1077.5 and 1350.5 are shown in green and brown, respectively. D, E, representative PQD spectra of iTRAQ-labeled FibA at different parameter settings. Color arrows indicate the fragment ions plotted in panels A, B, and C. Selected peaks are labeled with absolute signal intensities. Numbers above the red line refer to the summed signal intensities of all fragment ions at m/z values below and above the precursor. F, relative standard deviations measured for the ratio of reporter ion signal intensities 114 versus 117 at different microscan and target value settings and the required data acquisition time for respective tandem spectra. G, ratios of iTRAQ signal intensities for a BSA digest mixture (3.5:1, iTRAQ 114, 117) spiked into a complex peptide background (equal amounts of iTRAQ 114, 115, 116, 117) as a function of precursor ion isolation width.
F<sc>ig</sc>. 2.
Fig. 2.
Comparison of protein quantification by PQD on an LTQ Orbitrap and CID on a Q-Tof Ultima. A and C, two-dimensional iTRAQ intensity plots of proteins identified from a dilution series of a kinobead pulldown digest (A, Orbitrap; C, Q-Tof Ultima) with the highest protein concentration plotted on the x axis and the ×2 (blue), ×4 (orange), and ×8 (yellow) dilutions plotted on the y axis. Each dot represents a protein. Linear regression analysis on all proteins indicates good agreement with the applied sample amounts. B and D, precision of quantification as a function of the number of spectra (B, Orbitrap; D, Q-Tof Ultima) expressed as average protein -fold change of the dilutions relative to the highest protein concentration. Error bars indicate standard deviations. E, number of proteins, kinases, and spectra quantified from the Orbitrap (orange) and the Q-Tof Ultima (blue) data.
F<sc>ig</sc>. 3.
Fig. 3.
Comparison of sensitivity and precision of protein quantification by PQD and HCD using an iTRAQ-labeled BSA digest mixture (ratios 1:1:2.5:2.5). A, bar diagram representing identified (blue) and quantified (orange) spectra by PQD and HCD as a function of total amount of BSA digest injected on column. B, experimentally determined -fold changes from data in A. Error bars represent standard errors. CF, example PQD and HCD spectra; inserts show the iTRAQ reporter ion regions.
F<sc>ig</sc>. 4.
Fig. 4.
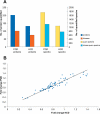
Performance characteristics of quantification by PQD and HCD on a iTRAQ-labeled kinobead pulldown digest. A, proteins (left, y axis) and spectra (right, y axis) quantified with PQD and HCD, respectively. Quantified proteins are shown in blue, kinases in orange; quantified spectra are shown in yellow (all proteins) and turquoise (kinases). B, two-dimensional plot comparing average protein -fold changes determined by PQD and HCD. Each blue dot represents a protein, and only proteins are included for which least three spectra were identified. The slope of the linear regression line is 1.08.
F<sc>ig</sc>. 5.
Fig. 5.
Kinase selectivity profile of imatinib in Lys-562 cell lysates. A, examples of competition binding curves calculated from iTRAQ reporter signals. Blue lines indicate the inflection point (50% of maximal competition) as well as 50% absolute competition. B, kinase-binding profile of imatinib for all 112 protein kinases simultaneously identified from Lys-562 cells in this experiment. Bars indicate IC50 values, defined as the concentration of imatinib at which half-maximal competition of kinobead binding is observed.

References

    1. Bantscheff, M., Schirle, M., Sweetman, G., Rick, J., and Kuster, B. ( 2007) Quantitative mass spectrometry in proteomics: a critical review. Anal. Bioanal. Chem. 389, 1017–1031 - PubMed
    1. Ong, S. E., and Mann, M. ( 2005) Mass spectrometry-based proteomics turns quantitative. Nat. Chem. Biol. 1, 252–262 - PubMed
    1. Wang, Y. K., Ma, Z., Quinn, D. F., and Fu, E. W. ( 2001) Inverse 18O labeling mass spectrometry for the rapid identification of marker/target proteins. Anal. Chem. 73, 3742–3750 - PubMed
    1. Wang, Y. K., Ma, Z., Quinn, D. F., and Fu, E. W. ( 2002) Inverse 15N-metabolic labeling/mass spectrometry for comparative proteomics and rapid identification of protein markers/targets. Rapid Commun. Mass Spectrom. 16, 1389–1397 - PubMed
    1. Wang, Y. K., Quinn, D. F., Ma, Z., and Fu, E. W. ( 2002) Inverse labeling-mass spectrometry for the rapid identification of differentially expressed protein markers/targets. J. Chromatogr. B Analyt. Technol. Biomed. Life Sci. 782, 291–306 - PubMed

LinkOut - more resources