. 2008 Nov;39(5):576-83.
doi: 10.1165/rcmb.2007-0460OC. Epub 2008 May 29.

mTOR mediates survival signals in malignant mesothelioma grown as tumor fragment spheroids

Affiliations

mTOR mediates survival signals in malignant mesothelioma grown as tumor fragment spheroids

Shannon M Wilson et al. Am J Respir Cell Mol Biol. 2008 Nov.

Abstract

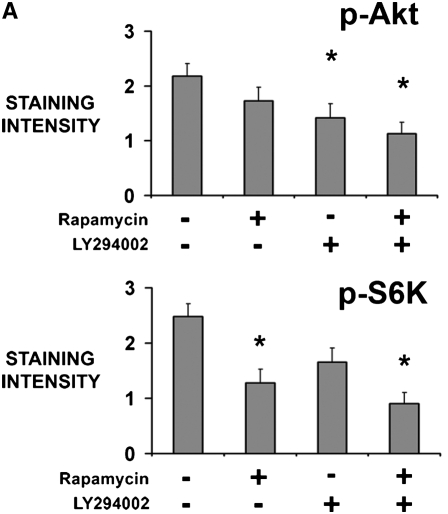
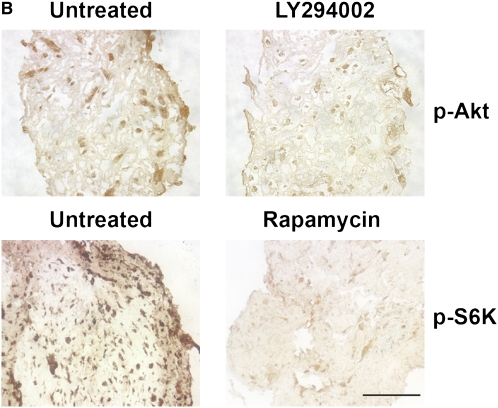
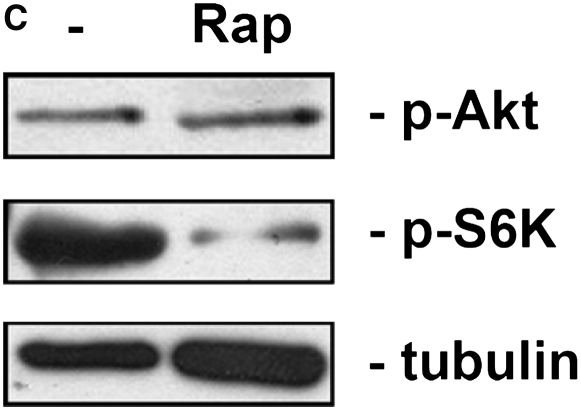
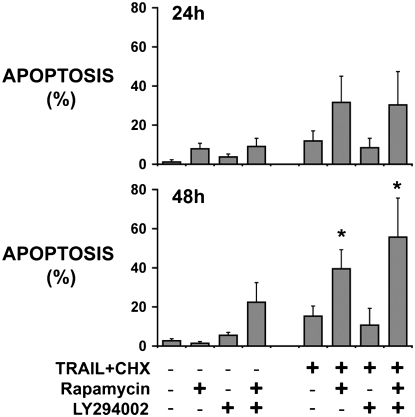
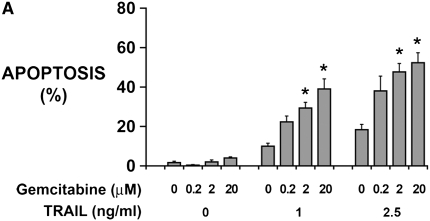
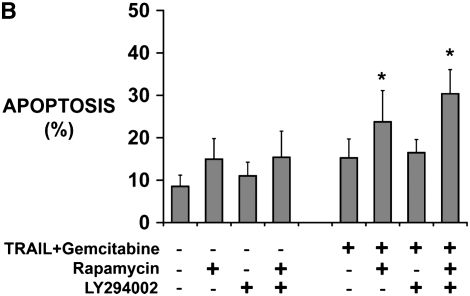
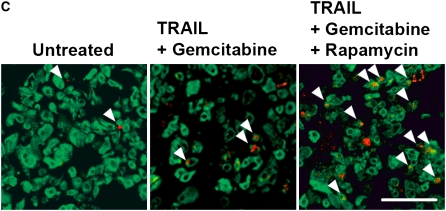
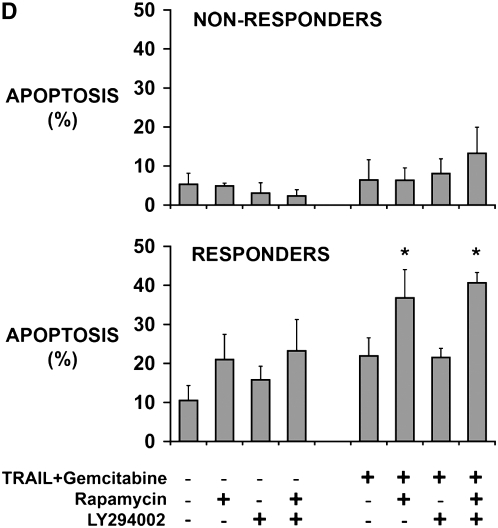
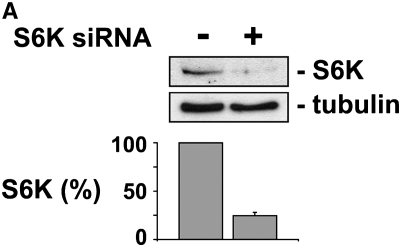
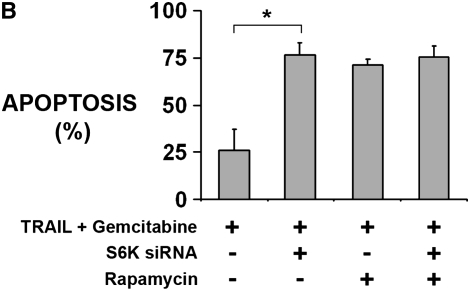
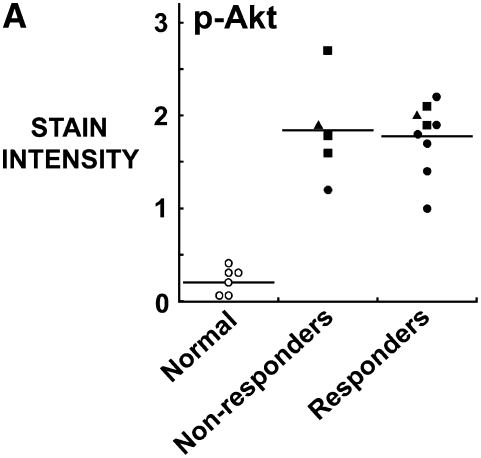
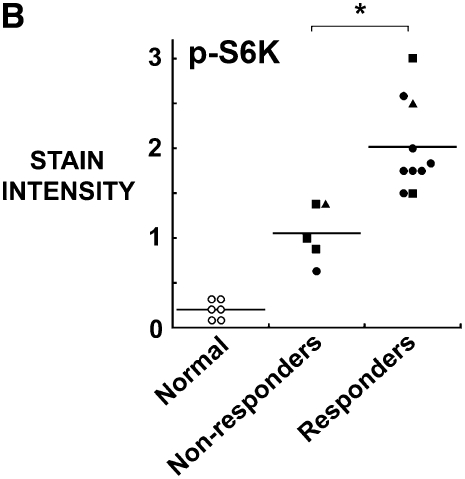
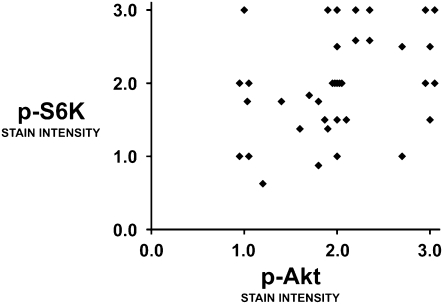
Solid tumors such as mesothelioma exhibit a stubborn resistance to apoptosis that may derive from survival pathways, such as PI3K/Akt/mTOR, that are activated in many tumors, including mesothelioma. To address the role of PI3K/Akt/mTOR, we used a novel approach to study mesothelioma ex vivo as tumor fragment spheroids. Freshly resected mesothelioma tissue from 15 different patients was grown in vitro as 1- to 2-mm-diameter fragments, exposed to apoptotic agents for 48 hours with or without PI3K/Akt/mTOR inhibitors, and doubly stained for cytokeratin and cleaved caspase 3 to identify apoptotic mesothelioma cells. Mesothelioma cells within the tumor spheroids exhibited striking resistance to apoptotic agents such as TRAIL plus gemcitabine that were highly effective against monolayers. In a majority of tumors (67%; 10 of 15), apoptotic resistance could be reduced by more than 50% by rapamycin, an mTOR inhibitor, but not by LY294002, a PI3K inhibitor. Responsiveness to rapamycin correlated with staining for the mTOR target, p-S6K, in the original tumor, but not for p-Akt. As confirmation of the role of mTOR, siRNA knockdown of S6K reproduced the effect of rapamycin in three rapamycin-responsive tumors. Finally, in 37 mesotheliomas on tissue microarray, p-S6K correlated only weakly with p-Akt, suggesting the existence of Akt-independent regulation of mTOR. We propose that mTOR mediates survival signals in many mesothelioma tumors. Inhibition of mTOR may provide a nontoxic adjunct to therapy directed against malignant mesothelioma, especially in those with high baseline expression of p-S6K.


Figures

<b>Figure 1.</b>
Figure 1.
Inhibitors of the PI3K/Akt/mTOR pathway show activity in tumor fragment spheroids. Tumor fragments were exposed to rapamycin, LY294002, or the combination for 48 hours and analyzed for expression of p-Akt and p-S6K by (A, B) immunohistochemistry or (C) immunoblot. (A) By immunohistochemistry, LY294002 was shown to decrease p-Akt, whereas rapamycin was shown to decrease p-S6K. The combination of rapamycin with LY294002 was effective at both. No apparent feedback activation of p-Akt after rapamycin was seen (* P < 0.05, different from no inhibitor; n = 4 tumor fragment spheroids from different tumors, mean ± SEM). (B) Representative images show that the inhibition of signaling molecules was found throughout the spheroid (bar = 200 μm). (C) By immunoblot of tumor fragments, rapamycin was shown to inhibit p-S6K without increasing p-Akt (blot representative of blots of tumor fragment spheroids from 3 separate tumors).
<b>Figure 2.</b>
Figure 2.
Rapamycin sensitizes human mesothelioma cells in tumor fragment spheroids to TRAIL plus cycloheximide. Tumor fragment spheroids were exposed for either 24 or 48 hours to TRAIL plus cycloheximide together with inhibitors of the PI3K/Akt/mTOR pathway. Apoptosis in the mesothelioma cells was counted after double labeling for cytokeratin and for cleaved caspase 3. Mesothelioma cell apoptosis was enhanced by rapamycin alone or together with LY294002 at 48 hours (*P < 0.05, different from control untreated at 48 h; n = 4, mean ± SEM).
<b>Figure 3.</b>
Figure 3.
Rapamycin sensitizes human mesothelioma cells in tumor fragment spheroids to TRAIL plus gemcitabine. (A) Mesothelioma cells (M28) in monolayer culture were exposed to varying concentrations of TRAIL (1 and 2.5 ng/ml) and gemcitabine (0.2–20 μM) and harvested at 24 hours. Whereas neither TRAIL nor gemcitabine alone increased apoptosis, the combination did (*P < 0.05, greater than sum of individual responses; n = 3, mean ± SEM). (B) Tumor fragment spheroids exposed to TRAIL plus gemcitabine together with inhibitors for 48 hours were double-stained for cytokeratin and cleaved caspase 3 and evaluated for apoptosis in the mesothelioma cells. Rapamycin, whether alone or with LY294002, was effective in increasing the response to TRAIL and gemcitabine (*P < 0.05, greater than to TRAIL + gemcitabine alone; n = 11, mean ± SEM) (C) Immunofluorescent images of tumor fragments show mesothelioma cells (green, stained for cytokeratin) and apoptotic cells (red, staining for cleaved caspase 3) (see arrows). There are some apoptotic mesothelioma cells in the control and in the spheroid exposed to TRAIL plus gemcitabine. In this tumor, the addition of rapamycin to the treatment with TRAIL plus gemcitabine led to a significant increase in apoptosis (bar = 100 μM). (D) Tumors responded differently to rapamycin. Tumors shown in B are separated here into those that responded to rapamycin with an increase in apoptosis of more than 50% (n = 7) and those that did not (n = 4) (*P < 0.05, greater than to TRAIL plus gemcitabine alone; n = 11, mean ± SEM).
<b>Figure 4.</b>
Figure 4.
S6K knockdown sensitizes human mesothelioma cells in tumor fragment spheroids to TRAIL plus gemcitabine. Tumor fragment spheroids were transfected with siRNA against S6K or a random, nontargeting sequence and then exposed for 48 hours to TRAIL plus gemcitabine. (A) Knockdown of S6K was confirmed by immunoblotting transfected tumor fragment spheroids after 48 hours. Immunoblot is representative of three different studies. Bar graph shows relative intensity of bands normalized to tubulin (n = 3, P < 0.05). (B) Knockdown of S6K enhanced the apoptosis of mesothelioma cells to TRAIL plus gemcitabine to the same extent as did rapamycin alone. Addition of rapamycin to tumor fragment spheroids with knockdown of S6K had no additional effect over S6K knockdown alone (*P < 0.05, n = 3 different tumors).
<b>Figure 5.</b>
Figure 5.
Response to rapamycin correlates with staining of original tumor for p-S6K but not for p-Akt. Paraffin-embedded mesothelioma tumors were used to generate a tissue microarray, stained for (A) p-Akt and (B) p-S6K and correlated with the response of the tumor fragment spheroids generated from these tumors to rapamycin. (A) Staining for p-Akt was elevated in all tumors compared with normal tissue, although there was no difference seen between tumors that responded to rapamycin and those that did not (n = 5 non-responders; n = 9 responders with one sample missing from study). (B) Staining for p-S6K was also elevated in all tumors compared with normal pleura and p-S6K, unlike p-Akt, correlated with the response to rapamycin (*P < 0.05, different from non-responders; n = 5 nonresponders, n = 10 responders). Open circles, normal; solid circles, mixed; squares, epithelial; triangles, sarcomatous.
<b>Figure 6.</b>
Figure 6.
p-S6K correlates weakly with p-Akt in mesothelioma tumors. A tumor microarray containing tissue from 37 mesotheliomas was stained for p-Akt and p-S6K and assessed for intensity of staining. Normal pleural samples (n = 5) had staining intensity below 0.5 (not shown). Correlation by Spearman rank was 0.41 (P < 0.013), suggesting a significant but weak correlation between p-Akt and p-S6K.

References

    1. Wendel HG, Lowe SW. Reversing drug resistance in vivo. Cell Cycle 2004;3:847–849. - PubMed
    1. Smalley KSM, Lioni M, Herlyn M. Life isn't flat: taking cancer biology to the next dimension. In Vitro Cell Dev Biol 2006;42:242–247. - PubMed
    1. Pampaloni F, Reynoud EG, Stelzer EHK. The third dimension bridges the gap between cell culture and live tissue. Nat Rev Mol Cell Biol 2007;8:839–845. - PubMed
    1. Kunz-Schughart LA, Freyer JP, Hofstaedter F, Ebner R. The use of 3-D cultures for high-throughput screening: the multicellular spheroid model. J Biomol Screen 2004;9:273–285. - PubMed
    1. Guertin DA, Sabatini DM. Defining the role of mTOR in cancer. Cancer Cell 2007;12:9–22. - PubMed

Publication types

MeSH terms