Comparative Study
. 2008 Aug;295(2):G234-51.
doi: 10.1152/ajpgi.00366.2007. Epub 2008 May 29.

A synthetic prostone activates apical chloride channels in A6 epithelial cells

Affiliations
Comparative Study

A synthetic prostone activates apical chloride channels in A6 epithelial cells

Hui Fang Bao et al. Am J Physiol Gastrointest Liver Physiol. 2008 Aug.

Abstract

The bicyclic fatty acid lubiprostone (formerly known as SPI-0211) activates two types of anion channels in A6 cells. Both channel types are rarely, if ever, observed in untreated cells. The first channel type was activated at low concentrations of lubiprostone (<100 nM) in >80% of cell-attached patches and had a unit conductance of approximately 3-4 pS. The second channel type required higher concentrations (>100 nM) of lubiprostone to activate, was observed in approximately 30% of patches, and had a unit conductance of 8-9 pS. The properties of the first type of channel were consistent with ClC-2 and the second with CFTR. ClC-2's unit current strongly inwardly rectified that could be best fit by models of the channel with multiple energy barrier and multiple anion binding sites in the conductance pore. The open probability and mean open time of ClC-2 was voltage dependent, decreasing dramatically as the patches were depolarized. The order of anion selectivity for ClC-2 was Cl > Br > NO(3) > I > SCN, where SCN is thiocyanate. ClC-2 was a "double-barreled" channel favoring even numbers of levels over odd numbers as if the channel protein had two conductance pathways that opened independently of one another. The channel could be, at least, partially blocked by glibenclamide. The properties of the channel in A6 cells were indistinguishable from ClC-2 channels stably transfected in HEK293 cells. CFTR in the patches had a selectivity of Cl > Br >> NO(3) congruent with SCN congruent with I. It outwardly rectified as expected for a single-site anion channel. Because of its properties, ClC-2 is uniquely suitable to promote anion secretion with little anion reabsorption. CFTR, on the other hand, could promote either reabsorption or secretion depending on the anion driving forces.


Figures

Fig. 1.
Fig. 1.
Schematic diagram of cell-attached recording from A6 epithelial monolayer. This figure shows a schematic of the typical recording situation for the experiments in this paper with A6 cells grown on permeable supports and electrical ground in the basolateral solution and the patch pipette applied to the apical surface of the cell. The potentials applied to the ion channels in cell-attached single-channel patches from isolated cells are typically offset by the membrane potential. In a tight epithelial monolayer with the electrical ground in the basolateral solution, the patch potential is actually offset by the entire transepithelial potential, VT. That is, the potential recorded by the patch amplifier is actually the displacement of the patch potential, VP, from the transepithelial potential. This implies that current-voltage relationships are shifted to the right by the magnitude of the transepithelial potential, which after lubiprostone can be as large as 80 mV (compare Figs. 2 and 6B). VA and VBL are the apical and basolateral membrane potentials, respectively. GND is bath ground.
Fig. 2.
Fig. 2.
Lubiprostone increases transepithelial current and voltage in A6 cells. A: effect of different concentrations of lubiprostone on total, amiloride-sensitive, and amiloride-insensitive transepithelial voltage. B: effect on transepithelial current. Adding even low concentrations of lubiprostone significantly increased transepithelial voltage and current. Lubiprostone did not produce a significant difference in amiloride-sensitive voltage and current (presumably sodium transport), although there might have been a small increase in current. On the other hand, lubiprostone caused a significant increase in amiloride-insensitive voltage and current. The increase in current produced by even the lowest concentrations of lubiprostone is particularly striking.
Fig. 3.
Fig. 3.
Lubiprostone activates small-conductance Cl channels in A6 cells. A: typical single-channel records from a cell-attached patch before application of lubiprostone with no obvious channel activity (patch potentials to the left of the traces are the potential displacement from the apical membrane potential-about −40 mM). The all-points amplitude histograms (0 mV at B; −60 mV at C) confirm that the patch is predominantly in a zero-current state (marked with an arrow to designate the closed state). D: after addition of 100 nM lubiprostone channel activity is easily observed and the all-points histograms (0 mV at E; −60 mV at F) reflect the fact that there are 2 current levels that were not previously visible (marked as open 1 and open 2). In this figure (and all subsequent figures), the arrows mark the level of the closed state.
Fig. 4.
Fig. 4.
Lubiprostone activates CFTR in A6 cells. A: typical single-channel records from a cell-attached patch before application of lubiprostone with no obvious channel activity (patch potentials to the left of the traces are the potential displacement from the apical membrane potential-about −40 mM). The all-points amplitude histograms (0 mV at B; −60 mV at C) confirm that the patch is predominantly in a zero-current state (marked with an arrow to designate the closed state). D: after addition of 100 nM lubiprostone channel activity is easily observed and the all-points histograms (0 mV at E; −60 mV at F) reflect the fact that there are 2 current levels that were not previously visible. The characteristics of the channel is consistent with the channel being CFTR. In this figure, arrows mark the level of the closed state.
Fig. 5.
Fig. 5.
ClC-2 and CFTR proteins are detectable by Western blotting in A6 cells. We used conventional Western blotting methods (see methods) on lysates of A6 cells and blotted for ClC-2 and CFTR. Equal amounts of cellular protein were loaded in each lane (determined by Bradford assay). Both channels proteins are easily detectable in A6 cells. CFTR had been previously reported (67), but ClC-2 has not been shown before in A6 cells (although it has been described in several other epithelia). The ClC-2 antibody detects a single band at 97 kDa and was obtained from U.S. Biologicals, Swampscott, MA (Clcn2, chloride channel: C5837-05E); the CFTR antibody detects bands that correspond to CFTR at 170 kDa and CFTR processing and degradation products at lower molecular weight. The antibody was obtained from Santa Cruz Biotechnology (Santa Cruz, CA; CFTR, N-20: sc-8909). The bands were competed by antigenic peptide obtained from the distributors.
Fig. 6.
Fig. 6.
Single-channel records show an anion channel with characteristic properties. Cells were pretreated with 100 nM lubiprostone for 5–15 min before forming a cell-attached seal. A: single-channel records were recorded from a complete series of voltages displacements from the membrane potential (0 mV displacement) for the 3-pS anion channel. More than 80% of the treated patches had this type of channel. This recording was made with amiloride in the pipette so that the recording could not be confounded by epithelial Na channel (ENaC) currents (which are generally present in the patches). The open probability and the unit current of the channel are large at hyperpolarized potentials and very small at depolarized potentials. In this figure, the arrows mark the level of the closed state. B: currents for ClC-2 strongly inwardly rectify. Such rectification is consistent with a multi-ion pore with greater access to the inner mouth of the pore than the outer mouth. The line through the data points is a fit of current to a multiple-barrier Eyring rate theory model (see text for details). The ratio of inward current to outward current is 1.37 ± 0.10, implying that the flux ratio for the channel is >1 and will secrete Cl much better than reabsorb Cl. The channel reverses at a positive potential because the current-voltage relationship is shifted to the right by the magnitude of the transepithelial voltage (see Fig. 1).
Fig. 7.
Fig. 7.
Single-channel records also show an anion channel with properties like CFTR. A: cells were pretreated with 100 nM lubiprostone for 5–15 min before forming a cell-attached seal. Single-channel records were recorded from a complete series of voltages displacements from the membrane potential (0 displacement) for the 8-pS anion channel. This recording was made with N-methyl-d-glucose replacing all cations in the pipette so that the recording could not be confounded by ENaC or any other cation channel currents. The open probability does not depend on voltage. The unit current of the channel is large at depolarized potentials and smaller at hyperpolarized potentials. The channel has the typical flickery closure at hyperpolarizing potentials that are characteristic of CFTR. In this figure, the arrows mark the level of the closed state. B: the current-voltage relationship for CFTR rectifies in a way expected for a single-site anion channel with more flux from the side that has a higher concentration of Cl (outward current/inward flux is greater than inward current/outward flux). The current through CFTR channels can be fit well with the Goldman-Hodgkin-Katz current equation. The fit provides estimates for CFTR channel permeability (6.74 ± 0.525 × 10⁻⁶ cm/s), the transepithelial potential (−41 ± 8.4 mV apical bath negative), and the intracellular Cl activity (38 ± 8.9. mM).
Fig. 8.
Fig. 8.
Models for the current-voltage relationships for ClC-2. The single-channel currents for ClC-2 strongly inwardly rectify. Such a property is consistent with a pore that has one or more barriers to ion movement and possible binding sites within the pore that will produce greater access to the inner mouth of the pore than the outer mouth. We fit the current-voltage data to several models that contained one or more energy barriers and energy wells (as described in methods). The fit to 3 of the models is shown in Fig. 8. As is obvious, the fit to a single energy barrier B1, although the model can produce strong inward rectification, fits the data very poorly. The fit of either model 2 (2 barriers, B1 and B2, and 1 well, W1) or model 3 (3 barriers, B1–B3, and 2 wells, W1 and W2) produces a fit that appears the same. However, model 2 has low-energy barriers and predicts an extremely high intracellular chloride concentration (see Table 1). The low-energy barriers seem inconsistent with the small unit conductance of ClC-2. Therefore, we tend to favor model 3 or a model with even more barriers and wells.
Fig. 9.
Fig. 9.
The transepithelial potential shifts the single-channel current-voltage relationships to the right. The reversal potential for ClC-2 in Fig. 6B appears more positive than might be expected for a Cl channel, but channels in cell-attached patches on cells in a tight epithelial monolayer also measure the transepithelial potential (Fig. 1); i.e., the voltages in the current-voltage relationship are the displacement of the patch potential from the transepithelial potential. Since lubiprostone activates transepithelial Cl transport, the transepithelial potential can be quite large if the monolayer is high resistance. The transepithelial potential will shift the current-voltage relationship to the right by up to 90 mV (see Fig. 2). This is approximately the deviation of the reversal potential from zero in Fig. 6B. Therefore, the apparent reversal potential will depend on variability in transepithelial potential: if the monolayer is intact the reversal potential may be far to the right; if there is even a very slight amount of edge damage the reversal potential will be close to zero. To test this possibility we reasoned that if we found a patch that had both CFTR and ClC-2, they should both reverse at the same potential whether it is very positive or close to zero. The current-voltage relationship above shows single-channel records (A) and the current-voltage relationships (B) for just such a patch with the 2 types of channels reversing at the same positive potential.
Fig. 10.
Fig. 10.
Lubiprostone activates ClC-2 at much lower doses than CFTR. This figure shows the frequency of ClC-2 and CFTR in patches in response to lubiprostone measured as the percentage of patches that contained one channel or the other. The frequency of ClC-2 (•) and CFTR (○) were fitted (solid lines) to the Hill equation (see results). This figure shows that much higher doses of lubiprostone are required to activate CFTR. The half-activating dose for ClC-2 is 69 ± 18.8 nM whereas for CFTR the dose is 791 ± 273 nM. The maximal response for ClC-2 and CFTR is 69 ± 7.8 and 61 ± 5.4% of patches with channels, respectively, and the slope coefficient for ClC-2 and CFTR is 1.5 ± 0.37 and 0.84 ± 0.13, respectively (all values are means ± SE).
Fig. 11.
Fig. 11.
Lubiprostone does not increase intracellular cAMP. Lubiprostone did not increase cAMP even at high dosages even though the positive control, forskolin, produced a robust cAMP increase.
Fig. 12.
Fig. 12.
The open probability and mean open and closed times of ClC-2 are voltage dependent. Figure 4 showed that as the apical membrane was made more positive, the frequency of ClC-2 events decreased. That is, the open probability of ClC-2 decreased at positive potentials. A: voltage sensitivity of the channel open probability. The decrease in open probability can be fit by a Boltzman relationship with half-maximal activation at 174 ± 8.4 mV and the open probability decreasing e-fold for ever 43 ± 3.2 mV of depolarization. If not visible, error bars are smaller than the symbols. Both the mean closed (B) and open (C) time of ClC-2 channels are also voltage sensitive. The decrease in open probability shown in A is due to both a decrease in channel mean open time and an increase in mean closed time. A shows the voltage dependence of mean closed times for positive potentials. With no applied potential, the mean closed time is 2,700 ± 377 ms. The increase in closed time was fit to a single exponential of function of voltage: formula image where τclosed and τ0 are the mean closed time at different applied voltages and at no applied potentials, respectively; α is the fraction of the membrane potential, V, altering the closed time, and R, T, and F have their standard meanings. The mean closed time increases with increasing voltage as if the voltage sensor for opening the channel senses 23 ± 3.4% of the transepithelial membrane potential. With no applied potential, the mean open time is 874 ± 22.6 ms and the mean open time decreases with increasing voltage as if the voltage sensor for closing the channel senses 76 ± 5.0% of the transepithelial membrane potential.
Fig. 13.
Fig. 13.
ClC-2 is a dimeric channel. We recorded from ClC-2 channels at negative potentials (maximum open probability) for several minutes and counted the apparent number of channels (as the difference between the minimum and maximum number of current levels). A histogram examining the frequency of observing different number of levels for 46 patches shows that even number of levels are strongly favored over odd numbers of levels, implying that ClC-2, like ClC-0, is also a dimeric Cl channel. There were few zero-level (empty) patches in the sample, reflecting the fact that in the presence of lubiprostone virtually all patches have activity (sometimes both types of channels). If ClC-2 channels were inserted into the membrane as monomers, then one would expect (based on a binomial distribution) levels for 1 and 3 channels comparable to 2 and 4 channels. In fact, the observed number of patches containing either 1 or 3 channels (black bars) is far below the predicted levels (light gray bars). The fact that we see some patches with what appears to be 3 channels probably means that, even when open probability is high, we have underestimated the number of channels in the patch.
Fig. 14.
Fig. 14.
ClC-2 and CFTR are more permeable to Cl than other anions. In our experiments, we filled the pipettes with either 96 mM NaCl (A), NaBr (B), or NaNO3 (C) (plus amiloride to ensure that there were no cation channels) or 115 mM NaI or NaSCN and recorded single-channel currents for inward and outward currents for Cl, Br, and NO3. Outward bromide current is relatively easy to detect, but outward NO3 current is difficult to observe. In this figure, the arrows mark the level of the closed state.
Fig. 15.
Fig. 15.
Current-voltage relationships for the different ions near the reversal potentials. The CFTR currents were fit to the Goldman-Hodgkin-Katz current equation and the ClC-2 channels were fit to a 3 barrier-2 well model. It is obvious from the reversal potentials that the order of permeability for ClC-2 is Cl > Br > NO3 (data not shown) > I > SCN and for CFTR is Cl > Br ≫ NO3 = I = SCN. Table 1 gives values for the permeability ratios for the ions that had significant outward current. The position of NO3 in the sequence for ClC-2 is ambiguous because little outward current was recorded and, therefore, the reversal potential was poorly determined. This implies that NO3 could be lower (but not higher) in the sequence of anions. For CFTR, we observed only small outward currents for SCN and no outward current for NO3, or I, even at the most depolarizing potentials (up to +250 mV), implying that the permeability of these latter 2 ions is <1% of Cl permeability.
Fig. 16.
Fig. 16.
I and SCN block ClC-2 channels. Both I and SCN reduce the mean open time of the channel for inward currents when open times are usually relatively long. At −60 mV, the mean open and closed times with external and internal Cl (top trace) were 211 ± 2.94 ms and 549 ± 4.47 ms, respectively. At the same potential, the mean open and closed times in the presence of I were 12.2 ± 4.24 ms and 85.4 ± 0.464 ms (bottom trace with expanded section) and in the presence of SCN were 18.2 ± 2.46 ms and 108 ± 0.199 ms (middle trace with expanded section). Such “trans-side” block has been extensively described for multi-ion cation channels (38, 50, 111). In this figure, the arrows mark the level of the closed state.
Fig. 17.
Fig. 17.
Lubiprostone activates ClC-2 in stably transfected HEK293 cells. We examined the properties of the predominant anion channels in HEK293 cells stably transfected with human ClC-2 (27) (A). The patches we formed on HEK cells were not as stable or as high resistance as those on A6 cells; however, the anion channel activated by lubiprostone had channel kinetics that were essentially indistinguishable from the channels in A6 cells we had identified as ClC-2 channels (Figs. 1 and 4). B: the current-voltage relationship of ClC-2 channels in stably transfected HEK293 cells. The current-voltage relationship of the anion channel activated by lubiprostone was essentially the same as that of the channels in A6 cells we had identified as ClC-2 channels (Fig. 6A). In this figure, the arrows mark the level of the closed state.
Fig. 18.
Fig. 18.
Glibenclamide blocks ClC-2. A: ClC-2 induced by 100 nM lubiprostone before (top) or after glibenclamide (0.1 mM), ordinarily considered a CFTR blocker. The all-point amplitude histograms below shows that glibenclamide significantly reduces the open state and increases the occupancy of the closed state (compare histograms in B and C). In this figure, the arrows mark the level of the closed state.
Fig. 19.
Fig. 19.
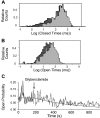
Glibenclamide appears to block open ClC-2 channels. Glibenclamide appears to be an open channel blocker since it reduces the mean open time as judged from the open-interval histograms (before glibenclamide in light gray; after in dark gray). The mean open time at −60 mV before glibenclamide is 60 ± 2.9 ms, which is reduced to 32 ± 2.2 ms and induces a second component in the closed-interval histogram (before glibenclamide in gray; after in dark gray). The closed-interval histogram before glibenclamide is best fit (as judged by a χ2 comparison) by a single exponential distribution with a mean closed time of 278 ± 3.3 ms, but after glibenclamide, the histogram is best fit by 2 exponential distributions with mean times of 233 ± 2.55 and 37 ± 5.6 ms. The second component (with the shorter mean duration) should represent the mean duration of the glibenclamide blocked state. C: open probability vs. time after exposure of the whole cell to glibenclamide. The block is relatively slow (the time constant for block is 466 ± 290 s) presumably reflecting the time necessary for glibenclamide to enter the cell and, even at long times, the block does not appear to be complete reflecting the fact that glibenclamide is not a particularly effective blocker of ClC-2. Nonetheless, the reduction in open probability (Po) is statistically significant (P < 0.001 by Mann-Whitney rank-sum test).

References

    1. Anonymous. Lubiprostone: RU 0211, SPI 0211. Drugs R D 6: 245–248, 2005. - PubMed
    1. Arreola J, Park K, Melvin JE, Begenisich T. Three distinct chloride channels control anion movements in rat parotid acinar cells. J Physiol 490: 351–362, 1996. - PMC - PubMed
    1. Bali M, Lipecka J, Edelman A, Fritsch J. Regulation of ClC-2 chloride channels in T84 cells by TGF-alpha. Am J Physiol Cell Physiol 280: C1588–C1598, 2001. - PubMed
    1. Bear CE, Li C, Galley K, Wang Y, Garami E, Ramjeesingh M. Coupling of ATP hydrolysis with channel gating by purified, reconstituted CFTR. J Bioenerg Biomembr 29: 465–473, 1997. - PubMed
    1. Becchetti A, Kemendy AE, Stockand JD, Sariban-Sohraby S, Eaton DC. Methylation increases the open probability of the epithelial sodium channel in A6 epithelia. J Biol Chem 275: 16550–16559, 2000. - PubMed

Publication types

MeSH terms

LinkOut - more resources