. 2008 Mar;47(3):245-248.
doi: 10.1097/CHI.0b013e318161e509.

What is an image?

Affiliations

What is an image?

Andrew J Gerber et al. J Am Acad Child Adolesc Psychiatry. 2008 Mar.
No abstract available


Conflict of interest statement

Disclosure: The authors report no conflicts of interest.

Figures

Fig. 1
Fig. 1
Composition of an image. Left, Each volume element (voxel) contains either high (H) or low (L) concentrations of a physical quantity of interest. Middle, The physical quantities of interest in each voxel are encoded numerically and assigned to a corresponding picture element (pixel) of the image. Right, The numerical quantity assigned to each pixel is assigned a level of grayness ranging from black to white and displayed in an array of pixels to reveal relationships between the physical quantities of interest (in this case, their spatial relationships) that would otherwise be difficult to discern in a simple listing of those quantities.
Fig. 2
Fig. 2
Computed tomography and magnetic resonance imaging of brain structure. W = white matter, C = caudate, T = thalamus, CSF = cerebrospinal fluid. Reprinted with permission from Lewis's Child and Adolescent Psychiatry. Philadelphia: Lippincott Williams & Wilkins; 2007:217.
Fig. 3
Fig. 3
Diffusion tensor imaging of fiber tracts. Colors depict directions of three-dimensional fiber tracts. Red = left (L) to right (R); green = posterior (P) to anterior (A); BG = basal ganglia; CC = corpus callosum. Reprinted with permission from Lewis's Child and Adolescent Psychiatry. Philadelphia: Lippincott Williams & Wilkins; 2007:224.
Fig. 4
Fig. 4
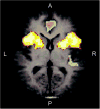
Functional magnetic resonance imaging of brain activity. This axial image (a slice parallel to the floor in a standing person) shows statistical significance of functional activity in one direction in bilateral basal ganglia, inferior frontal and anterior temporal cortex, and in the opposite direction in the anterior cingulate cortex and right anterior temporal cortex. A = anterior; P = posterior; R = right; L = left.
Fig. 5
Fig. 5
Magnetic resonance spectroscopy (MRS) of brain metabolites. One subregion of the brain is represented by several voxels, each of which generates a spectrum of signals from various neurometabolites. The height of each peak in the spectrum indicates the relative concentration of the corresponding metabolite. NAA = N-acetyl aspartate; tCr = total creatine; tCh = total choline; Glu = glutamate; Ins = myoinositol.

Publication types