

Three-dimensional mapping of mechanical activation patterns, contractile dyssynchrony and dyscoordination by two-dimensional strain echocardiography: rationale and design of a novel software toolbox
- PMID: 18513412
- PMCID: PMC2429897
- DOI: 10.1186/1476-7120-6-22
Three-dimensional mapping of mechanical activation patterns, contractile dyssynchrony and dyscoordination by two-dimensional strain echocardiography: rationale and design of a novel software toolbox
Abstract
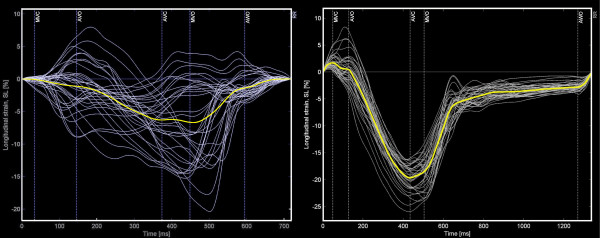
Background: Dyssynchrony of myocardial deformation is usually described in terms of variability only (e.g. standard deviations SD's). A description in terms of the spatio-temporal distribution pattern (vector-analysis) of dyssynchrony or by indices estimating its impact by expressing dyscoordination of shortening in relation to the global ventricular shortening may be preferential. Strain echocardiography by speckle tracking is a new non-invasive, albeit 2-D imaging modality to study myocardial deformation.
Methods: A post-processing toolbox was designed to incorporate local, speckle tracking-derived deformation data into a 36 segment 3-D model of the left ventricle. Global left ventricular shortening, standard deviations and vectors of timing of shortening were calculated. The impact of dyssynchrony was estimated by comparing the end-systolic values with either early peak values only (early shortening reserve ESR) or with all peak values (virtual shortening reserve VSR), and by the internal strain fraction (ISF) expressing dyscoordination as the fraction of deformation lost internally due to simultaneous shortening and stretching. These dyssynchrony parameters were compared in 8 volunteers (NL), 8 patients with Wolff-Parkinson-White syndrome (WPW), and 7 patients before (LBBB) and after cardiac resynchronization therapy (CRT).
Results: Dyssynchrony indices merely based on variability failed to detect differences between WPW and NL and failed to demonstrate the effect of CRT. Only the 3-D vector of onset of shortening could distinguish WPW from NL, while at peak shortening and by VSR, ESR and ISF no differences were found. All tested dyssynchrony parameters yielded higher values in LBBB compared to both NL and WPW. CRT reduced the spatial divergence of shortening (both vector magnitude and direction), and improved global ventricular shortening along with reductions in ESR and dyscoordination of shortening expressed by ISF.
Conclusion: Incorporation of local 2-D echocardiographic deformation data into a 3-D model by dedicated software allows a comprehensive analysis of spatio-temporal distribution patterns of myocardial dyssynchrony, of the global left ventricular deformation and of newer indices that may better reflect myocardial dyscoordination and/or impaired ventricular contractile efficiency. The potential value of such an analysis is highlighted in two dyssynchronous pathologies that impose particular challenges to deformation imaging.
Figures


Similar articles
-
Septal deformation patterns delineate mechanical dyssynchrony and regional differences in contractility: analysis of patient data using a computer model.Circ Heart Fail. 2012 Jan;5(1):87-96. doi: 10.1161/CIRCHEARTFAILURE.111.962704. Epub 2011 Oct 6. Circ Heart Fail. 2012. PMID: 21980078
-
Assessment of mechanical dyssynchrony in cardiac resynchronization therapy.Dan Med J. 2014 Dec;61(12):B4981. Dan Med J. 2014. PMID: 25441737 Review.
-
Comparative mechanical activation mapping of RV pacing to LBBB by 2D and 3D speckle tracking and association with response to resynchronization therapy.JACC Cardiovasc Imaging. 2010 May;3(5):461-71. doi: 10.1016/j.jcmg.2009.12.014. JACC Cardiovasc Imaging. 2010. PMID: 20466341
-
Efficacy on resynchronization and longitudinal contractile function comparing His-bundle pacing with conventional biventricular pacing: a substudy to the His-alternative study.Eur Heart J Cardiovasc Imaging. 2023 Dec 21;25(1):66-74. doi: 10.1093/ehjci/jead181. Eur Heart J Cardiovasc Imaging. 2023. PMID: 37490036 Clinical Trial.
-
Left bundle branch block and echocardiography in the era of CRT.J Echocardiogr. 2015 Mar;13(1):6-14. doi: 10.1007/s12574-014-0233-1. Epub 2014 Nov 26. J Echocardiogr. 2015. PMID: 26184516 Review.
Cited by
-
Echocardiographic prediction of outcome after cardiac resynchronization therapy: conventional methods and recent developments.Heart Fail Rev. 2011 May;16(3):235-50. doi: 10.1007/s10741-010-9200-8. Heart Fail Rev. 2011. PMID: 21104122 Free PMC article. Review.
-
Acute and chronic response to CRT in narrow QRS patients.J Cardiovasc Transl Res. 2012 Apr;5(2):232-41. doi: 10.1007/s12265-011-9338-3. Epub 2011 Dec 30. J Cardiovasc Transl Res. 2012. PMID: 22207279 Clinical Trial.
-
Local microRNA-133a downregulation is associated with hypertrophy in the dyssynchronous heart.ESC Heart Fail. 2017 Aug;4(3):241-251. doi: 10.1002/ehf2.12154. Epub 2017 Apr 3. ESC Heart Fail. 2017. PMID: 28772031 Free PMC article.
-
Two-dimensional speckle-tracking echocardiographic assessment of left ventricular mechanical synchrony in clinically normal cats.Vet Med (Auckl). 2016 Mar 23;7:33-40. doi: 10.2147/VMRR.S97634. eCollection 2016. Vet Med (Auckl). 2016. PMID: 30050835 Free PMC article.
-
Mechano-energetics of the asynchronous and resynchronized heart.Heart Fail Rev. 2011 May;16(3):215-24. doi: 10.1007/s10741-010-9205-3. Heart Fail Rev. 2011. PMID: 21103927 Free PMC article. Review.
References
-
- Vagnini FJ, Gourin A, Antell HI, Stuckey JH. Implantation sites of cardiac pacemaker electrodes and myocardial contractility. Ann Thorac Surg. 1967;4:431–439. - PubMed
-
- Wyman BT, Hunter WC, Prinzen FW, McVeigh ER. Mapping propagation of mechanical activation in the paced heart with MRI tagging. Am J Physiol. 1999;276:H881–891. - PubMed
-
- Leclercq C, Faris O, Tunin R, Johnson J, Kato R, Evans F, Spinelli J, Halperin H, McVeigh E, Kass DA. Systolic improvement and mechanical resynchronization does not require electrical synchrony in the dilated failing heart with left bundle-branch block. Circulation. 2002;106:1760–1763. doi: 10.1161/01.CIR.0000035037.11968.5C. - DOI - PubMed
-
- Leach JK, Brady AJ, Skipper BJ, Millis DL. Effects of active shortening on tension development of rabbit papillary muscle. Am J Physiol. 1980;238:H8–13. - PubMed
MeSH terms
LinkOut - more resources
Full Text Sources
Other Literature Sources
Medical
Molecular Biology Databases
Research Materials
Miscellaneous
