

Genome-wide linkage analysis of a Parkinsonian-pyramidal syndrome pedigree by 500 K SNP arrays
- PMID: 18513678
- PMCID: PMC2427312
- DOI: 10.1016/j.ajhg.2008.05.005
Genome-wide linkage analysis of a Parkinsonian-pyramidal syndrome pedigree by 500 K SNP arrays
Abstract
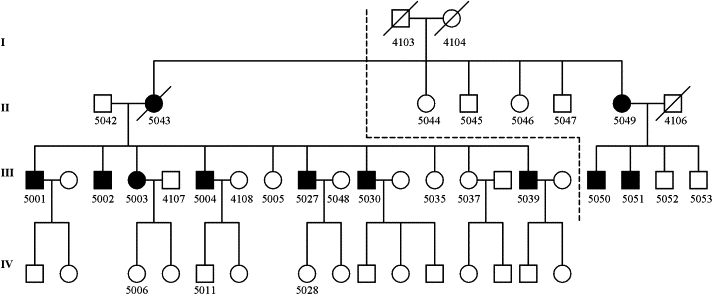
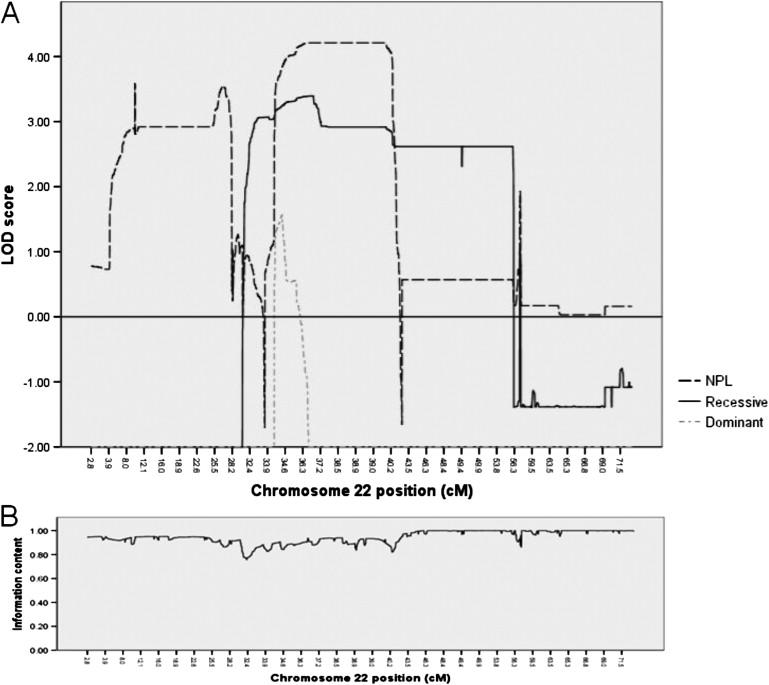
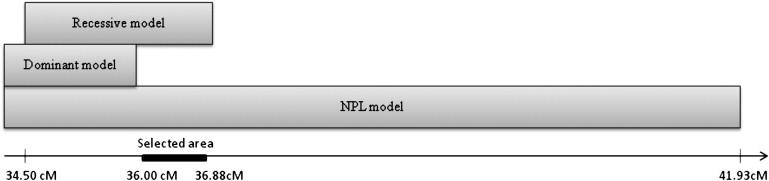
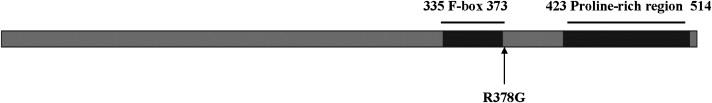
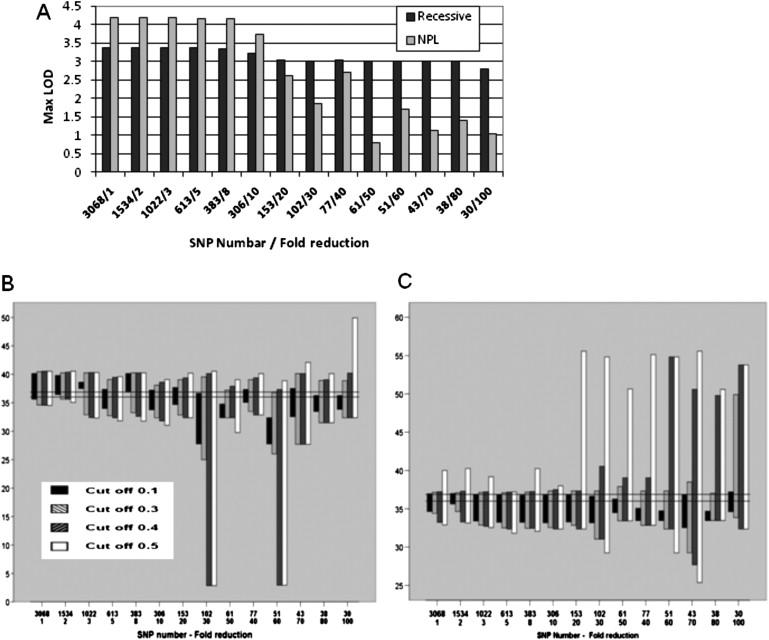
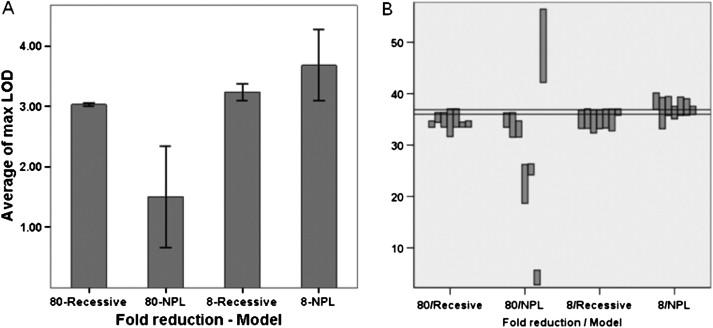
Robust SNP genotyping technologies and data analysis programs have encouraged researchers in recent years to use SNPs for linkage studies. Platforms used to date have been 10 K chip arrays, but the possible value of interrogating SNPs at higher densities has been considered. Here, we present a genome-wide linkage analysis by means of a 500 K SNP platform. The analysis was done on a large pedigree affected with Parkinsonian-pyramidal syndrome (PPS), and the results showed linkage to chromosome 22. Sequencing of candidate genes revealed a disease-associated homozygous variation (R378G) in FBXO7. FBXO7 codes for a member of the F-box family of proteins, all of which may have a role in the ubiquitin-proteosome protein-degradation pathway. This pathway has been implicated in various neurodegenerative diseases, and identification of FBXO7 as the causative gene of PPS is expected to shed new light on its role. The performance of the array was assessed and systematic analysis of effects of SNP density reduction was performed with the real experimental data. Our results suggest that linkage in our pedigree may have been missed had we used chips containing less than 100,000 SNPs across the genome.
Figures
References
-
- Sheffield V.C., Weber J.L., Buetow K.H., Murray J.C., Even D.A., Wiles K., Gastier J.M., Pulido J.C., Yandava C., Sunden S.L. A collection of tri-and tetranucleotide repeat markers used to generate high quality, high resolution human genomewide linkage maps. Hum. Mol. Genet. 1995;4:1837–1844. - PubMed
-
- Weissenbach J., Gyapay G., Dib C., Vignal A., Morissette J., Millasseau P., Vaysseix G., Lathrop M. A second-generation linkage map of the human genome. Nature. 1992;359:794–801. - PubMed
-
- Goddard K.A., Wijsman E.M. Characteristics of genetic markers and maps for cost-effective genome screens using diallelic markers. Genet. Epidemiol. 2002;22:205–220. - PubMed
-
- Kruglyak L. The use of a genetic map of biallelic markers in linkage studies. Nat. Genet. 1997;17:21–24. - PubMed
Publication types
MeSH terms
Substances
LinkOut - more resources
Full Text Sources
Other Literature Sources
Medical
Molecular Biology Databases
