Review
. 2008 Sep;48(20):2070-89.
doi: 10.1016/j.visres.2008.03.021. Epub 2008 May 29.

Neuronal mechanisms of visual stability

Affiliations
Review

Neuronal mechanisms of visual stability

Robert H Wurtz. Vision Res. 2008 Sep.

Abstract

Human vision is stable and continuous in spite of the incessant interruptions produced by saccadic eye movements. These rapid eye movements serve vision by directing the high resolution fovea rapidly from one part of the visual scene to another. They should detract from vision because they generate two major problems: displacement of the retinal image with each saccade and blurring of the image during the saccade. This review considers the substantial advances in understanding the neuronal mechanisms underlying this visual stability derived primarily from neuronal recording and inactivation studies in the monkey, an excellent model for systems in the human brain. For the first problem, saccadic displacement, two neuronal candidates are salient. First are the neurons in frontal and parietal cortex with shifting receptive fields that provide anticipatory activity with each saccade and are driven by a corollary discharge. These could provide the mechanism for a retinotopic hypothesis of visual stability and possibly for a transsaccadic memory hypothesis, The second neuronal mechanism is provided by neurons whose visual response is modulated by eye position (gain field neurons) or are largely independent of eye position (real position neurons), and these neurons could provide the basis for a spatiotopic hypothesis. For the second problem, saccadic suppression, visual masking and corollary discharge are well established mechanisms, and possible neuronal correlates have been identified for each.


Figures

Figure 1
Figure 1
The two problems saccades produce for the visual system. A. Schematic saccades (blue lines) and fixations (blue dots) used to illustrate the consequences of the saccades for vision. The painting is titled An Unexpected Visitor by Ilya Repin, and was made famous in vision research by Alfred Yarbus who used it as one of the illustrations he had his subjects look at while he recorded their eye movements. B. The snapshots at the location of each fixation. Shading is intended to indicate reduction of acuity as the distance from the fovea increases. C. The transmission in the optic nerve of the snapshots form three fixations without any information about location but with the interspersed blurs from the intervening saccades.
Figure 2
Figure 2
Three signals available for producing visual stability: Visual field motion (reafference), Proprioception (extraretinal inflow), Corollary Discharge (CD –extraretinal outflow).
Figure 3
Figure 3
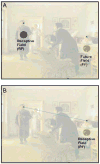
The logic of shifting receptive fields and remapping. A. Receptive Field and Future Field at the time of the saccade. B. Future field has become the new Receptive Field after the saccade. See text for explanation.
Figure 4
Figure 4
An example FEF neuron with a shifting RF. The visual response is aligned on the visual probe flashed during fixation (left column) and just before the saccade (right column). Probes were in the RF (top row), in the Future Field (FF, middle row), or absent as a control in the bottom row. The visual response shifts from the RF (magenta, left) to the FF (magenta, middle) just before the saccade. Each trace is the mean and s.e.m; vertical scale is 110 sp/s; horizontal tick marks, 100ms. Modified from Sommer and Wurtz, 2006.
Figure 5
Figure 5
Brain circuits for visually guided saccades (A) and saccade based corollary discharge (CD, B). See text for description.
Figure 6
Figure 6
The spatial (A) and temporal (B) characteristics for shifting RFs are consistent with an input from the CD passing through MD thalamus. A. The shifting RFs would be expected to jump from the RF to the FF with no significant change in activity at the midpoint if the shift resulted from the vector input of a CD. An example FEF neuron shows this lack of midpoint activity consistent with the shift being driven by a CD. From Sommer and Wurtz, 2008. B. The timing of the shifting RF should be synchronized with the saccade as is the CD. In the upper record the activity of an example FEF neuron aligned on saccade onset shows that the increased activity with the shift is synchronized with saccade initiation. In the lower record, the same neuronal responses are aligned on visual probe onset, and show that the increase in activity with the shift occurs long after the visual latency (black arrow). The green dots show the time of saccade onset in each trial. From Sommer and Wurtz, 2006.
Figure 7
Figure 7
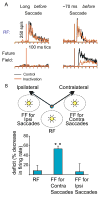
Necessity of CD input from MD thalamus for shifting RFs in FEF. A. Example of a shifting RF impaired by MD inactivation. During inactivation (orange traces) the activity in the future field decreased by 78%. B. The deficit in the population of neurons. Reductions in activity were seen only in the FF, not the RF, and only for contralateral, not ipsilateral, saccades. ** significant changes at p < 0.0001 level. From Sommer and Wurtz, 2006.
Figure 8
Figure 8
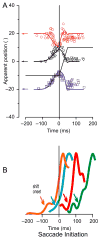
Saccadic mislocalization (A) and a possible correlate in shifting RFs (B). A. Mislocalization of the position of a bar briefly presented around the time of a horizontal saccade from −10° to +10° (black stepped line). The apparent position judged by the subject (ordinate) is plotted against the display times relative to the onset of a saccade (abscissa, 0° refers to the screen center). The bar was presented at one of three positions on the screen (−20°, 0°, 20°, indicated by the arrows). The result was that subjects systematically mislocated the bar. For bars presented at −20° or 0°, they were mislocalized in the direction of the saccade at about the same time as the onset of a saccade. For bars presented at +20° they were mislocated in the opposite direction (against the direction of the saccade). The combination produced an effective compression of visual space. Adapted, with permission, from Ross et al. 2001. B. Spread in shift onset times given by four example FEF neurons. The orange trace is from the neuron in Fig. 6B. Shift magnitudes are normalized to each other for comparison of timing. From Sommer and Wurtz, 2008.
Figure 9
Figure 9
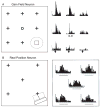
Possible inputs to a spatial map. A. An example gain field neuron from posterior parietal cortex. On the left drawing of the screen in front of the monkey, when the monkey looked at the central fixation point (o), the RF was mapped out and was found to be in the lower right quadrant (dashed circle). On the right, the response of the neuron aligned on stimulus onset is shown for fixation at the center of the screen by the record at 0, 0. Then the monkey fixated at one of the other eight positions on the screen (left drawing) each separated by 20°. At each fixation position the stimulus was moved so that it fell on the RF. Even though the stimulus fell on the same retinotopic position, the gain of the visual response changed systematically as the monkey’s eye position changed. These responses are shown on the right. The strongest response was with fixation in the upper left, the weakest with fixation in the lower right. Modified from Andersen, Essick, and Segal, 1985). B. An example real position neuron from area V6A. The stimulus was always in the lower right quadrant (dashed line), and +s indicate the five fixation points on an 80° wide screen. The visual response was nearly the same regardless of the fixation point. Modified from Galletti and Fattori 2002.
Figure 10
Figure 10
Saccadic suppression by CD. A. Response of an MT neuron to a moving visual stimulus (lower record) but failure to do so during a saccadic eye movement (upper record). From Thiele et al. 2002. B. Example SC superficial layer neuron that responds to a moving visual stimulus in front of the stationary eye but not during a saccade. The visual stimulus moved across the RF (left record) or was moved across the RF by a saccade (right record). Peak of ordinate is 250 sp/s; tick marks on the abscissa are 100 ms. From Robinson and Wurtz 1976. C. An example SC superficial neuron demonstrated to have input from a corollary discharge. On the left and right is the suppression during normal saccades (in the light to maintain background discharge rate). In the center is the suppression that continues during retrobulbar block of both eyes. All of the records are triggered on the integrated burst of activity of the oculomotor nucleus (Oc. Nuc), that remained even when the EOG for horizontal and vertical components of the saccade were eliminated by the block (center). Peak of ordinate is 20 sp/s; tick marks on the abscissa are 100 ms. From Richmond and Wurtz 1980.
Figure 11
Figure 11
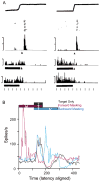
Saccadic suppression by visual masking. A. Forward masking in a V1 neuron by a masking stimulus falling on the RF (line under each trace) on a subsequent brief RF stimulus(carrot under the trace). In the left column, the eye sweeps the RF across a stationary RF stimulus, and on the right the RF stimulus is swept across a stationary RF during fixation. The top records show the visual response to the RF stimulus only, the middle trace the reduced response to the RF stimulus when preceded by the mask, and the bottom trace to the mask only. Ordinate tick marks are 100 sp/s; abscissa marks are 100ms. From Judge, Wurtz, and Richmond 1980. B. Forward and backward masking in a V1 neuron in an alert monkey. Black trace is the response of the neuron to the RF stimulus alone (Target Only). Pink trace shows the elimination of the on response by forward masking. Blue trace shows the elimination of the transient after discharge by backward masking. From Macknik and Livingstone 1998)

References

    1. Andersen RA. Visual and eye movement functions of the posterior parietal cortex. Annu Rev Neurosci. 1989;12:377–403. - PubMed
    1. Andersen RA, Essick GK, Siegel RM. Encoding of spatial location by posterior parietal neurons. Science. 1985;230(4724):456–458. - PubMed
    1. Andersen RA, Mountcastle VB. The influence of the angle of gaze upon the excitability of the light-sensitive neurons of the posterior parietal cortex. J Neurosci. 1983;3(3):532–548. - PMC - PubMed
    1. Andersen RA, Snyder LH, Bradley DC, Xing J. Multimodal representation of space in the posterior parietal cortex and its use in planning movements. Annu Rev Neurosci. 1997;20:303–330. - PubMed
    1. Baldauf D, Wolf M, Deubel H. Deployment of visual attention before sequences of goal-directed hand movements. Vision Res. 2006;46(26):4355–4374. - PubMed