. 2008 Jun;28(6):799-809.
doi: 10.1016/j.immuni.2008.03.019. Epub 2008 May 29.

The B cell receptor governs the subcellular location of Toll-like receptor 9 leading to hyperresponses to DNA-containing antigens

Affiliations

The B cell receptor governs the subcellular location of Toll-like receptor 9 leading to hyperresponses to DNA-containing antigens

Akanksha Chaturvedi et al. Immunity. 2008 Jun.

Abstract

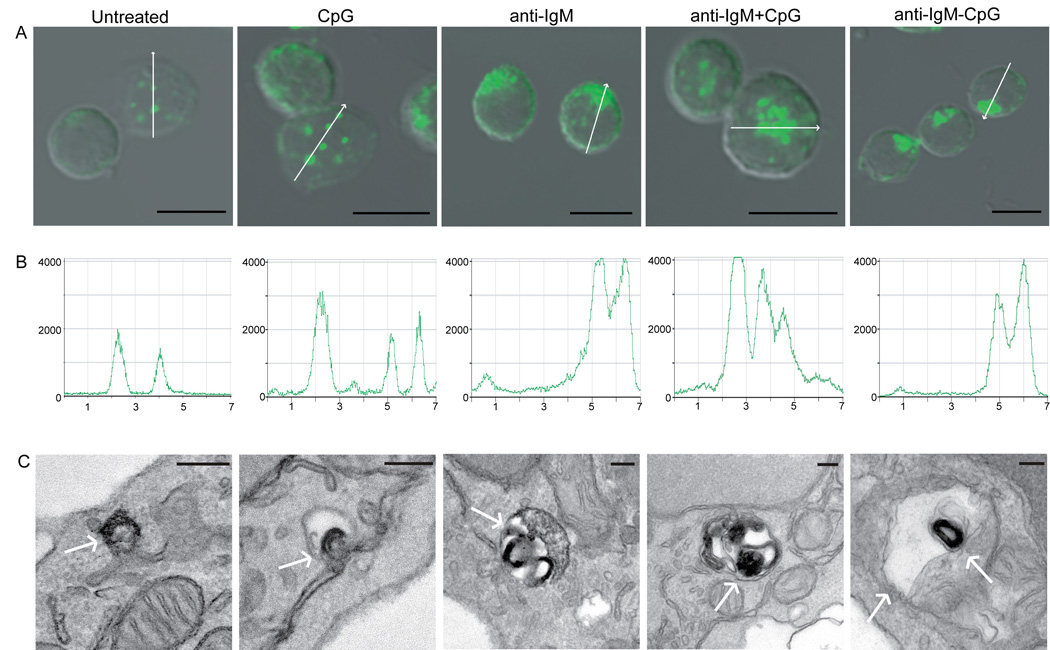
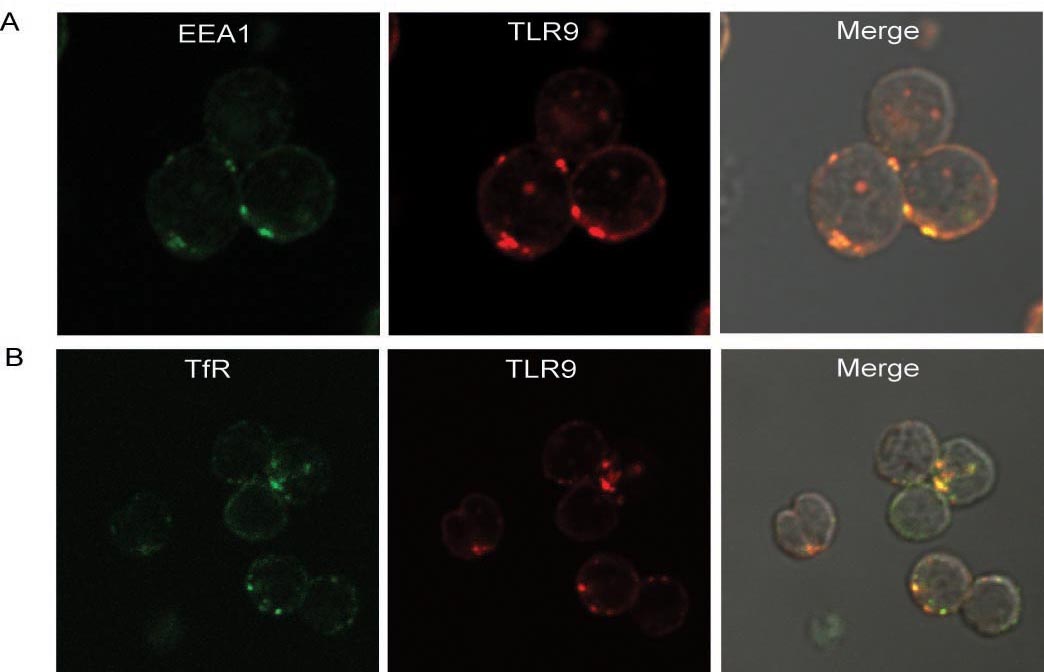
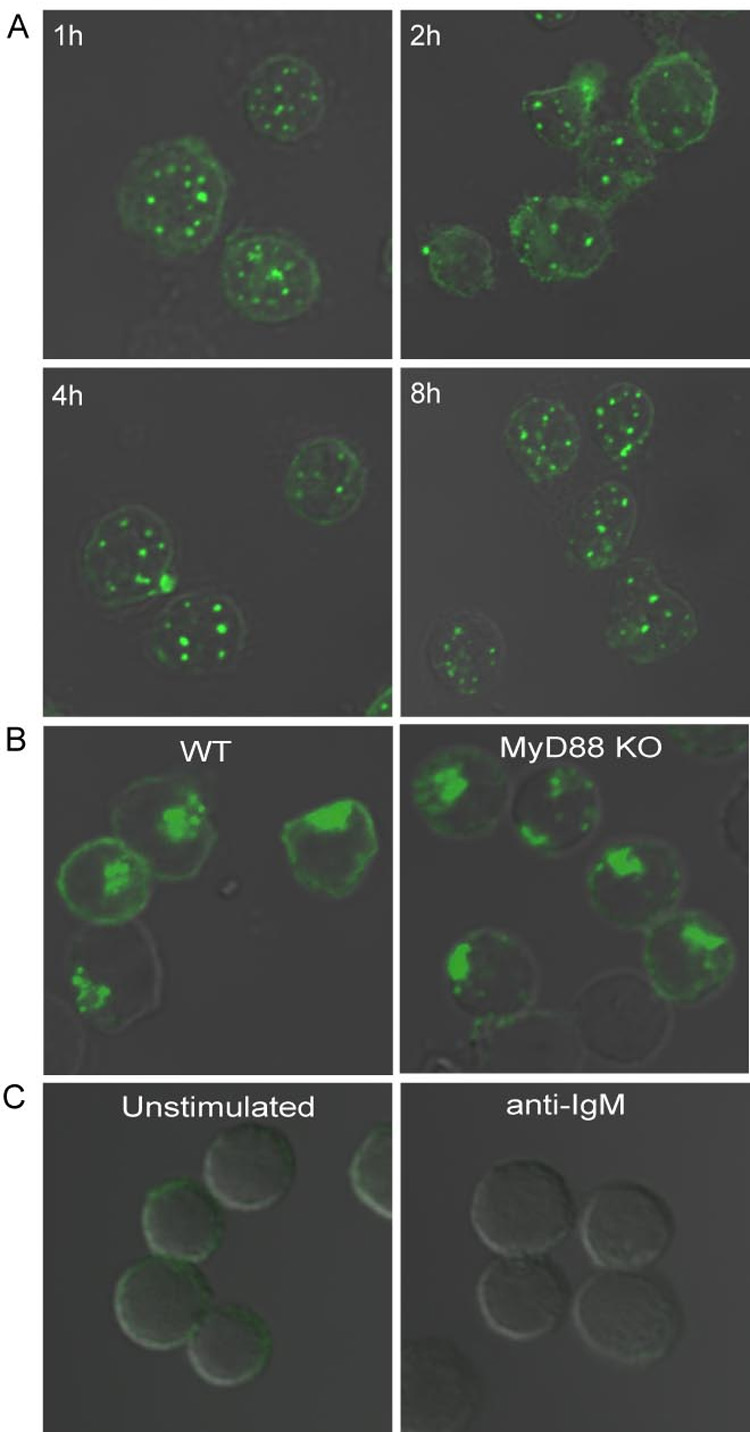
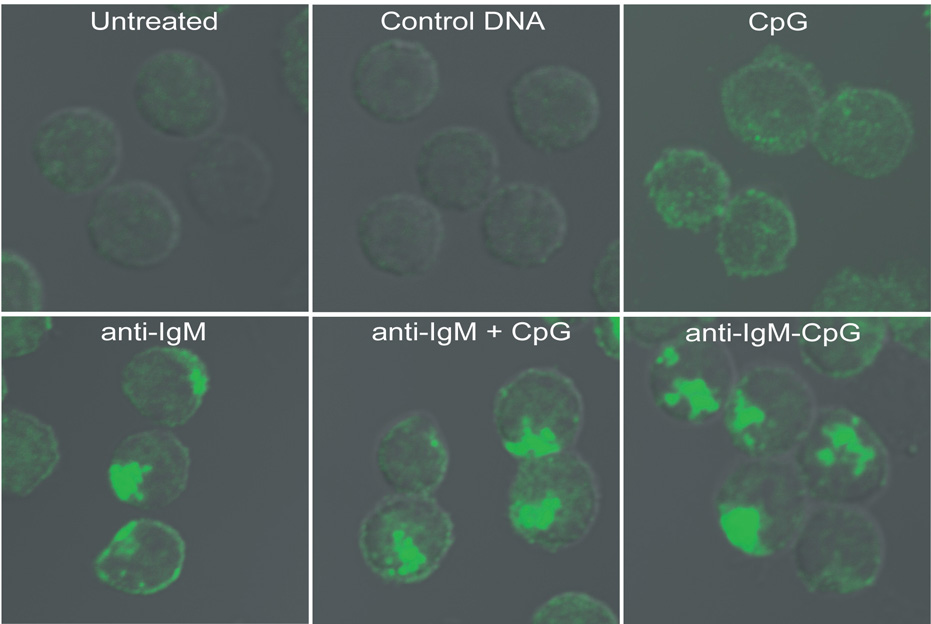
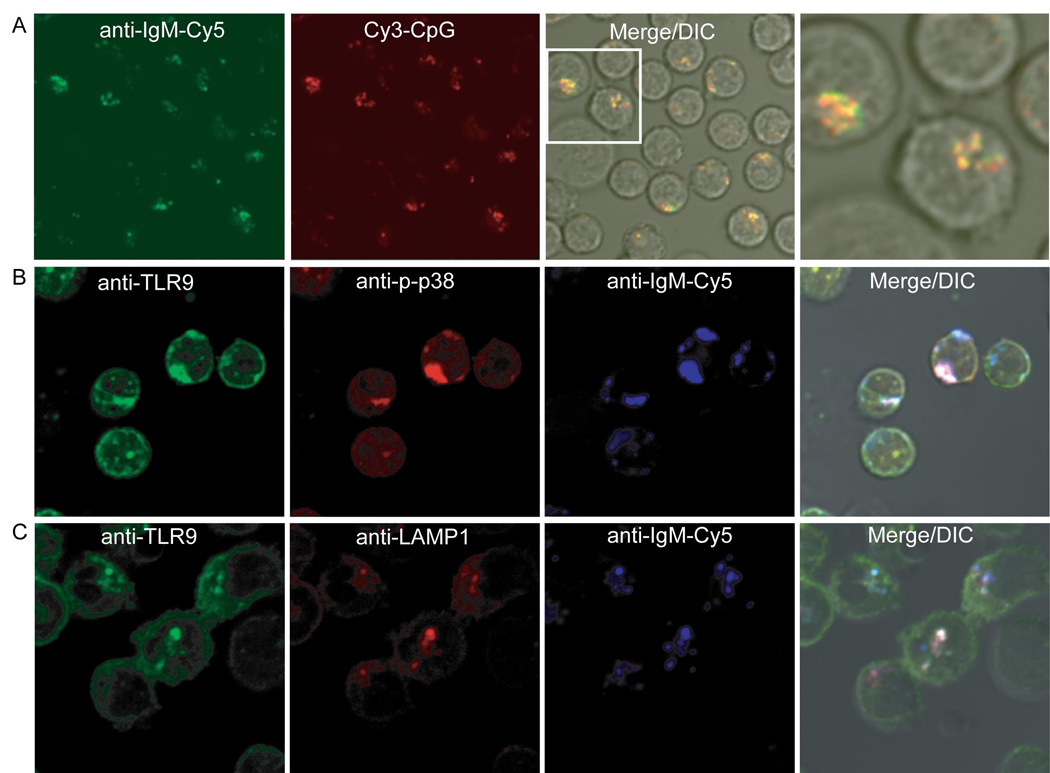
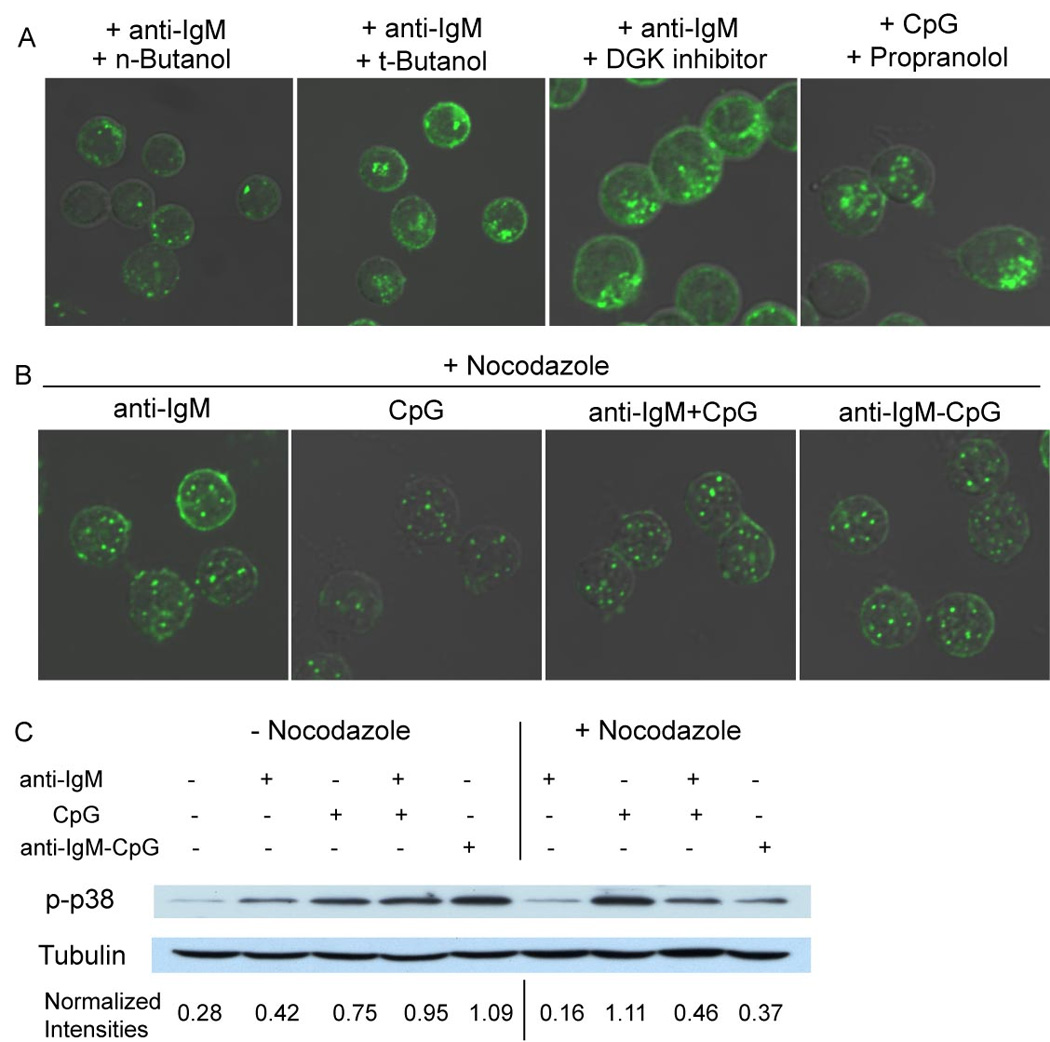
Synergistic engagement of the B cell receptor (BCR) and Toll-like receptor 9 (TLR9) in response to DNA-containing antigens underlies the production of many autoantibodies in systemic autoimmune diseases. However, the molecular basis of this synergistic engagement is not known. Given that these receptors are spatially segregated, with the BCR on the cell surface and TLR9 in endocytic vesicles, achieving synergy must involve unique mechanisms. We show that upon antigen binding, the BCR initiates signaling at the plasma membrane and continues to signal to activate MAP kinases as it traffics to autophagosome-like compartments. The internalized BCR signals through a phospholipase-D-dependent pathway to recruit TLR9-containing endosomes to the autophagosome via the microtubular network. The recruitment of TLR9 to the autophagosomes was necessary for hyperactivation of MAP kinases. This unique mechanism for BCR-induced TLR9 recruitment resulting in B cells hyperresponses may provide new targets for therapeutics for autoimmune diseases.


Figures

Figure 1
Figure 1. BCR and TLR9 costimulation reduces the threshold for p38 phosphorylation and increases CD40 and α6-integrin expression
(A). The percent of mouse splenic B cells staining for p-p38- Alexa 488 with time is shown for B cells from wild type mice following treatment with: CpG DNA alone (open squares); anti-IgM alone (closed squares); anti-IgM plus CpG DNA (closed circles) and the anti-IgM-CpG DNA conjugate (open circles). Approximately 250 cells were examined by confocal microscopy for each condition in 3 independent experiments as described in Methods. Error bars represent standard deviation. (B). Same as in (A) except B cells from MyD88-deficient mice were used. (C). Mouse splenic B cells were either untreated or incubated with: 10µg/ml anti-IgM alone; 3µM stimulatory CpG DNA alone; both 10µg/ml anti-IgM and 3µM CpG DNA or 10µg/ml anti-IgM-CpG DNA conjugate for 48 h. Cells were stained for B220 and CD40 or α6 integrin or CD54 using appropriately fluorescent antibodies specific for each. Shown are the CD40, α6 integrin and CD54 staining in the B220 positive population.
Figure 2
Figure 2. Subcellular location of TLR9 changes upon BCR crosslinking
(A). Mouse splenic B cells were either untreated or stimulated with: 3µM CpG DNA alone; 10µg/ml anti-IgM alone; 10µg/ml anti-IgM plus 3µM CpG or 10µg/ml anti-IgM-CpG conjugate for 60 min. The merged confocal fluorescent Alexa 488 and differential interference contrast (DIC) images are shown. Over 500 cells were analyzed for each condition in 20 independent experiments and representative images are shown. Scale bars represent 5µm. (B). The intensity analyses of Alexa 488- anti-TLR9 in representative cells in the direction shown by the white arrow in A. (C). The immunoelectron microscopy images of cells stained with HRP-anti-TLR9 for cells treated as in panel A. The HRP reaction product DAB, visible as a dark stain, represents the location of TLR9 as shown by white arrow. Scale bars represent 100nm.
Figure 3
Figure 3. Colocalization of TLR9 to early endosome markers in resting cells
(A) Mouse splenic B cells were stained with antibodies specific for EEA1 labeled with Alexa 488 or for TLR9 labeled with Alexa 647. Shown are the confocal images of Alexa 488 and Alexa 647 merged with DIC images. (B) Mouse splenic B cells were stained with antibodies specific for transferrin receptor (TfR) labeled with Alexa 555 or for TLR9 labeled with Alexa 647. Shown are the confocal images of Alexa 555 and Alexa 488 merged with DIC images. Approximately 200 cells were analyzed from 3 independent experiments and a representative image is given.
Figure 4
Figure 4. TLR9 recruitment is dependent on BCR signaling but independent of TLR9 signaling
(A). Mouse splenic B cells were incubated with 3µM CpG for 1 to 8 hr and stained for TLR9 as described. Shown in the panel are DIC images merged with confocal images of Alexa 488. (B). Wild-type and MyD88- deficient B cells were incubated with 10µg/ml anti-IgM for 60 min, and stained for TLR9 as described. Shown are the DIC images merged with confocal images of Alexa 488. (C). TLR9- deficient B cells were either untreated or incubated with 10µg/ml anti-IgM for 60 min, and stained for TLR9 as described. Shown are the DIC images merged with confocal images of Alexa 488. Approximately 200 cells were analyzed for each condition in 5 independent experiments and representative images are provided.
Figure 5
Figure 5. Phosphorylation of p38 occurs in distinct subcellular compartments following BCR and TLR9 stimulation
Mouse splenic B cells were either untreated or incubated with: 3µM control GpC DNA; 3µM stimulatory CpG DNA alone; 10µg/ml anti-IgM alone; both 10µg/ml anti-IgM and 3µM CpG DNA; or 10µg/ml anti-IgM-CpG DNA conjugate for 60 min. In each case the cells were fixed, permeabilized and stained for p-p38 using rabbit antibodies specific for p-p38, followed by Alexa 488-labeled goat antibodies specific for rabbit Ig. Shown are the DIC images merged with confocal images of Alexa 488. Approximately 250 cells were analyzed for each condition in 6 independent experiments and representative images are provided.
Figure 6
Figure 6. Internalized BCR colocalizes with TLR9 in LAMP-1 positive compartments
(A). Mouse splenic B cells were stimulated with 3µM Cy3-labeled CpG and 10µg/ml Cy5-labeled anti-IgM for 60 min and analyzed by fluorescent confocal microscopy. Shown are merged DIC and confocal images of Cy3-CpG and Cy5-anti-IgM. (B). Mouse splenic B cells were incubated with 10µg/ml Cy5-anti-IgM for 60 min, fixed, permeabilized and stained as described for TLR9 and p-p38. Shown are the merged DIC and confocal images of Cy5-anti-IgM, Alexa 488 for TLR9 and Alexa 565 for anti-p-p38. (C). Same as in (B) except cells were stained for TLR9 and LAMP1 and shown are the merged DIC and confocal images of Cy5-anti-IgM, Alexa 488 for TLR9 and Alexa 565 for LAMP-1. Approximately 200 cells were analyzed for each condition in 4 independent experiments and representative images are provided.
Figure 7
Figure 7. BCR induced TLR9 recruitment to autophagosome-like compartments requires PLD activity and the microtubular network
(A). Mouse splenic B cells were incubated with: 10µg/ml anti-IgM in the presence of 0.3% (v/v) n-Butanol; 0.3% (v/v) t-Butanol; or 10µM DGK inhibitor R59949. Alternatively, cells were incubated with 3µM CpG in the presence of 100µM PAP inhibitor Propranolol for 60 min. Cells were stained for TLR9 as described. Merged confocal and DIC images of Alexa 488 are shown. (B). Cells were incubated with 10µg/ml anti-IgM; 3µM CpG DNA alone; both 10µg/ml anti-IgM and 3µM CpG DNA or 10µg/ml anti-IgM-CpG DNA conjugate in the presence of nocodazole (100µg/ml) for 60 min. Cells were stained for TLR9 as described. Shown are confocal and DIC images of Alexa 488. Approximately 200 cells were analyzed for each condition in 5 independent experiments and representative images are provided. (C). Mouse splenic B cells were either untreated or incubated with: 10µg/ml anti-IgM alone; 3µM stimulatory CpG DNA alone; both 10µg/ml anti-IgM and 3µM CpG DNA or 10µg/ml anti-IgM-CpG DNA conjugate either in the absence or presence of nocodazole for 60 min. Cytoplasmic extracts were prepared and analyzed by SDS-PAGE and immunoblotting, probing with p-p38-specific antibodies. Blots were stripped and reprobed with tubulin-specific antibodies. The intensity of the p-p38 and tubulin bands were quantified using ImageJ software and expressed as a ratio of p-p38 to tubulin for each condition.

Comment in

References

    1. Ahmad-Nejad P, Hacker H, Rutz M, Bauer S, Vabulas RM, Wagner H. Bacterial CpG-DNA and lipopolysaccharides activate Toll-like receptors at distinct cellular compartments. Eur J Immunol. 2002;32:1958–1968. - PubMed
    1. Akira S, Takeda K, Kaisho T. Toll-like receptors: critical proteins linking innate and acquired immunity. Nat Immunol. 2001;2:675–680. - PubMed
    1. Barton GM, Kagan JC, Medzhitov R. Intracellular localization of Toll-like receptor 9 prevents recognition of self DNA but facilitates access to viral DNA. Nat Immunol. 2006;7:49–56. - PubMed
    1. Bernasconi NL, Onai N, Lanzavecchia A. A role for Toll-like receptors in acquired immunity: up-regulation of TLR9 by BCR triggering in naive B cells and constitutive expression in memory B cells. Blood. 2003;101:4500–4504. - PubMed
    1. Blommaart EF, Krause U, Schellens JP, Vreeling-Sindelarova H, Meijer AJ. The phosphatidylinositol 3-kinase inhibitors wortmannin and LY294002 inhibit autophagy in isolated rat hepatocytes. Eur J Biochem. 1997;243:240–246. - PubMed

Publication types

MeSH terms