

Virtual epidemic in a virtual city: simulating the spread of influenza in a US metropolitan area
- PMID: 18514138
- PMCID: PMC2753587
- DOI: 10.1016/j.trsl.2008.02.004
Virtual epidemic in a virtual city: simulating the spread of influenza in a US metropolitan area
Abstract
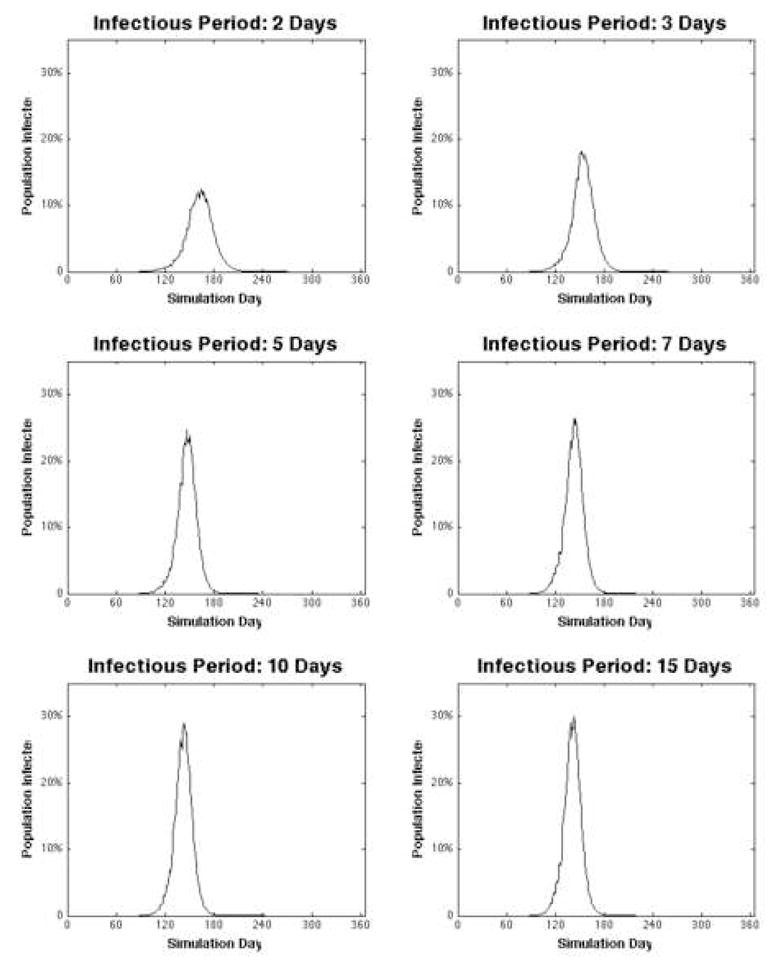
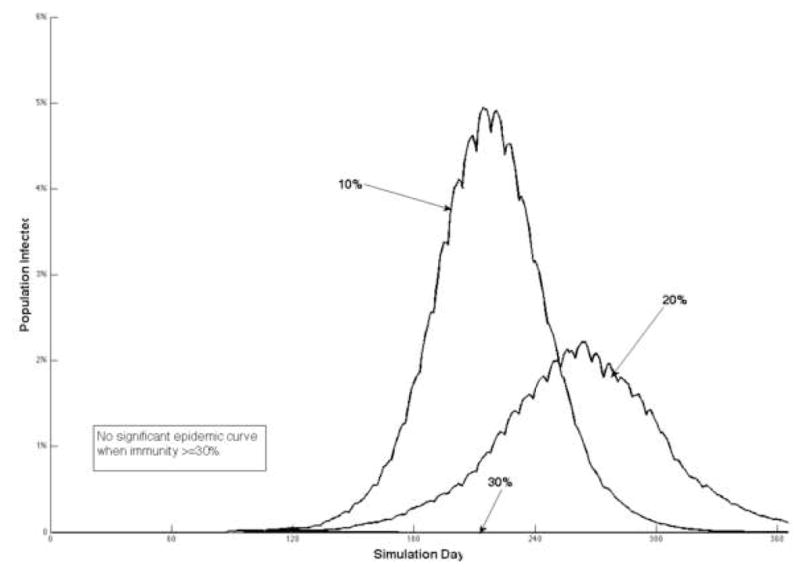
A wide variety of biologic, physiologic, social, economic, and geographic factors may affect the transmission, spread, and impact of influenza. Recent concerns about an impending influenza epidemic have generated a need for predictive computer simulation models to forecast the spread of influenza and the effectiveness of prevention and control strategies. We designed an agent-based computer simulation of a theoretical influenza epidemic in Norfolk, Va, that included extensive city-level details and computer representations of every Norfolk citizen, including their expected behavior and social interactions. The simulation introduced 200 infected cases on November 27, 2002 (day 87), and tracked the progress of the epidemic. On average, the prevalence peaked on day 178 (12.2% of the population). Our model showed a cyclical variation in influenza cases by day of the week with fewer people being exposed on weekends, differences in emergency room and clinic visits by day of the week, an earlier peak in influenza cases, and persistent high prevalence among people age 65 or older and the daily prevalence of infection among health-care workers. The level of detail included in our simulation model made these findings possible. Compared with other existing models, our model has a very extensive and detailed social network, which may be important because individuals with more social interactions and extensive social networks may be more likely to spread influenza. Our simulation may serve as a virtual laboratory to better understand the way different factors and interventions affect the spread of influenza.
Figures


Comment in
-
The virtue of virtuality: the promise of agent-based epidemic modeling.Transl Res. 2008 Jun;151(6):273-4. doi: 10.1016/j.trsl.2008.04.002. Epub 2008 May 12. Transl Res. 2008. PMID: 18514137 No abstract available.
References
-
- Tsuang WM, Bailar JC, Englund JA. Influenza-like symptoms in the college dormitory environment: a survey taken during the 1999–2000 influenza season. J Environ Health. 2004;66:39–42. 4. - PubMed
-
- Grais RF, Ellis JH, Glass GE. Assessing the impact of airline travel on the geographic spread of pandemic influenza. Eur J Epidemiol. 2003;18:1065–72. - PubMed
-
- Anderson PJ. Factors promoting pathogenicity of influenza virus. Semin Respir Infect. 1991;6:3–10. - PubMed
Publication types
MeSH terms
Grants and funding
LinkOut - more resources
Full Text Sources
Medical
