. 2008 Jun 20;379(5):929-35.
doi: 10.1016/j.jmb.2008.04.062. Epub 2008 May 3.

Structural basis for the regulation of muscle contraction by troponin and tropomyosin

Affiliations

Structural basis for the regulation of muscle contraction by troponin and tropomyosin

Agnieszka Galińska-Rakoczy et al. J Mol Biol. .

Abstract

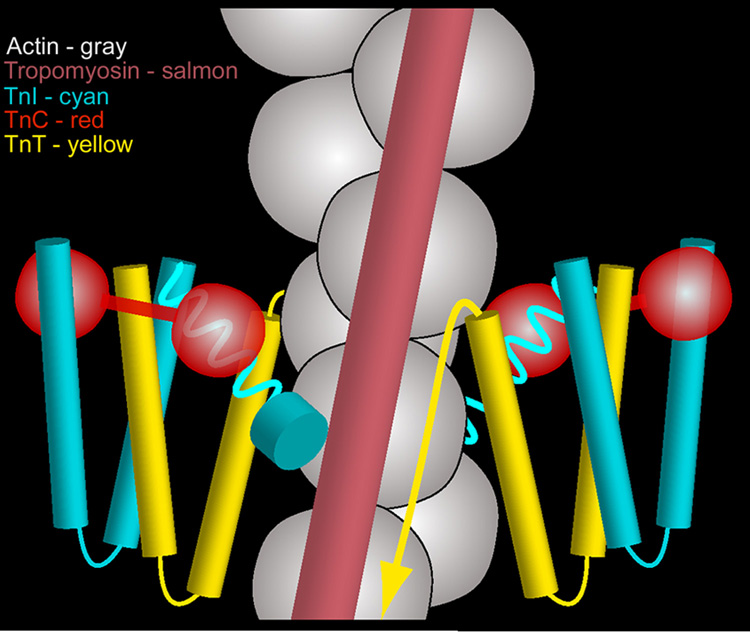
The molecular switching mechanism governing skeletal and cardiac muscle contraction couples the binding of Ca2+ on troponin to the movement of tropomyosin on actin filaments. Despite years of investigation, this mechanism remains unclear because it has not yet been possible to directly assess the structural influence of troponin on tropomyosin that causes actin filaments, and hence myosin-crossbridge cycling and contraction, to switch on and off. A C-terminal domain of troponin I is thought to be intimately involved in inducing tropomyosin movement to an inhibitory position that blocks myosin-crossbridge interaction. Release of this regulatory, latching domain from actin after Ca2+ binding to TnC (the Ca2+ sensor of troponin that relieves inhibition) presumably allows tropomyosin movement away from the inhibitory position on actin, thus initiating contraction. However, the structural interactions of the regulatory domain of TnI (the "inhibitory" subunit of troponin) with tropomyosin and actin that cause tropomyosin movement are unknown, and thus, the regulatory process is not well defined. Here, thin filaments were labeled with an engineered construct representing C-terminal TnI, and then, 3D electron microscopy was used to resolve where troponin is anchored on actin-tropomyosin. Electron microscopy reconstruction showed how TnI binding to both actin and tropomyosin at low Ca2+ competes with tropomyosin for a common site on actin and drives tropomyosin movement to a constrained, relaxing position to inhibit myosin-crossbridge association. Thus, the observations reported reveal the structural mechanism responsible for troponin-tropomyosin-mediated steric interference of actin-myosin interaction that regulates muscle contraction.


Figures

Fig. 1
Fig. 1
Electron micrographs of negatively stained filaments. F-actin control filaments (a), F-actin decorated with cTerm-TnI (b), F-actin-tropomyosin decorated with cTerm-TnI (c). Note the increase in diameter due to the TnI label, particularly in (c). Filaments are shown with their pointed ends facing up; polarity was determined by alignment tools in reference 22. Scale bar = 50 nm. Preparation and assay of proteins: F-actin, cardiac troponin and tropomyosin were purified as previously. cTerm-TnI was expressed and purified as follows: The cDNA for human cardiac TnI residues 131–210 was inserted into pET3d, transformed into Rosetta pLysS cells, and a single colony used to seed 1L of Overnight Express Media (CalBiochem/Novagen). Cells were lysed with sonication in 20mM Tris buffer (pH 8.0), 20% sucrose, 1mM EDTA, 5µg/ml TPCK, 5µg/ml TLCK and 0.3mM PMSF. The pellet fraction was resuspended and sonicated in 10mM MOPS buffer (pH 7.0), 5M urea, 1mM dithiothreitol, 5µg/ml each of TPCK and TLCK, 0.01% NaN3 and 0.3mM PMSF. The supernatant fraction was dialyzed against 10mM MOPS (pH 7. 0), 2mM dithiothreitol, 5µg/ml TPCK and TLCK, 0.01% NaN3 and 0.3mM PMSF, and purified by successive SP Sepharose and AKTA system-Resource S columns. Protein concentration was determined by quantitative amino acid analysis, and identify confirmed by MALDI-MS. Actin-activated S1 MgATPase rates were measured at 25 °C in the presence of 10mM MOPS (pH 7), 1mM dithiothreitol, 4mM MgCl2, 5mM KCl, 1.0mM ATP, 1mM phosphoenolpyruvate, 3mg/ml pyruvate kinase, 0.2 mg/ml lactate dehydrogenase, and the rate of NADH (0.3mM) oxidation monitored spectrophotometrically for 5 minutes. EM and image processing: Filaments were prepared by mixing a two-fold molar excess of cTerm-TnI (40 µM) with F-actin or F-actin-tropomyosin (20 µM) to optimize binding in 100mM NaCl, 3mM MgCl2, 1mM NaN3, 0.2mM EGTA, 1mM dithiothreitol, 5mM sodium phosphate/5mM Pipes buffer (pH 7.0) at 25°C. The mixture was diluted 20-fold, applied to carbon-coated grids and stained with 1% uranyl acetate. EM was done on a Philips CM120 EM at a magnification of X45,000 under low dose conditions (~12 e/Å). Helical reconstruction and single particle reconstruction were performed by standard methods as previously. Both methods revealed comparable cTerm-TnI density. The significance of the densities contributing to cTerm-TnI, was evaluated by using a Student’s t-test,.
Fig. 2
Fig. 2
Surface views of thin filament reconstructions showing the position of cTerm-TnI on F-actin and F-actin-tropomyosin. Reconstructions of: (a) F-actin (subdomains noted). (b) F-actin decorated with cTerm-TnI; note density (white arrowheads) bridging between azimuthally neighboring actin subunits from subdomain 1 of one actin to subdomain 4 of the other. (c) Difference densities (blue), derived by subtracting F-actin from cTerm-TnI decorated F-actin, then shown superimposed on F-actin. (d) F-actin-tropomyosin decorated with cTerm-TnI; the TnI density is again seen bridging between azimuthally neighboring actin monomers (arrowheads), but the extra density here is more elongated and traverses obliquely over the lower actin (black open arrows). The TnI density ends as a finger-like mass (asterisk) on a clenched-hand that approaches and drapes over tropomyosin (white arrow). (e) Difference densities (blue for TnI and red for tropomyosin) between cTerm-TnI decorated F-actin-tropomyosin and F-actin, shown superimposed on F-actin. All of the reconstructions of thin filaments obtained were aligned to each other and are shown with filament pointed ends facing up.
Fig. 3
Fig. 3
Fitting F-actin and tropomyosin models into reconstructions. Atomic models of F-actin and tropomyosin were docked into EM density envelopes, using coordinates previously determined. The azimuthal location of tropomyosin is the same as that found previously for the blocked state,,,. (a) Reconstruction of F-actin-tropomyosin decorated with cTerm-TnI (enlargement of part of Fig. 2d, actin subdomains noted, other symbols the same as in Fig. 2); (b) ribbon models of two actin monomers (gold, yellow) and tropomyosin (red) fitted within the EM envelope shown in (a), displayed here in wire-mesh; TnI density is seen to originate near actin’s C-terminal residues 360 to 366 on subdomain 1 of actin0 (helix highlighted in white), to cross the cleft between actin subunits and over helix 223 to 232 (green) on subdomain 4 of actin−1, to buttress against tropomyosin at actin residues 309 to 330 (magenta) and to end over the tropomyosin strand (red); (c) same as (b) but now the fitting shown with one actin monomer (yellow space filling model) and tropomyosin (red space filling model), here highlighting amino acids on actin, which are thought to interact electrostatically with tropomyosin in the high-Ca2+ (“closed”) state (pink, acidic, blue, basic amino acids). Note that cTerm-TnI covers several of these amino acids clusters and hence sites occupied by C-state tropomyosin.
Fig. 4
Fig. 4
Electron tomography of thin filaments reconstituted from actin, tropomyosin and intact troponin. Surface views of averaged tomograms from 61 filaments maintained in low-Ca2+. (a) the core domain (arrowhead) of troponin is seen face on; note the trilobed density, where the upper two lobes match the near perpendicular orientation suggested for TnC relative to F-actin,, while the rest would correspond to the TnIT arm,. (b) orthogonal rotation of the tomogram shows a side view of the core domain from which a ridge of density (open arrows) emerges and crosses laterally over the surface of the filament. (c) fitting the atomic model of F-actin-tropomyosin within the tomogram, rotated as in (b) and made translucent (actin monomers alternately yellow, coral and orange; tropomyosin, red); note that the length of the ridge of density is sufficient to reach from the core domain to tropomyosin; further, this density follows a path comparable to that of cTerm-TnI in the reconstructions above and ends as a pad of density at a similar spot on the tropomyosin position as does the TnI domain (asterisks in (b) and (c)). Given the low resolution of the tomograms and possible uncertainties about domain positions in the low-Ca2+ crystal structure of the troponin core complex, fitting these two structures to each other did not seem warranted. Moreover, the region of particular interest here, namely the C-terminal end of TnI, is not resolved in the low-Ca2+ crystal structure, since in the absence of its binding to actin, this region of TnI is likely to be disordered,. Tomography protocols: Electron tomograms of thin filaments, prepared as previously, were derived from EMs captured in a tilt series consisting of 1° increments between ±68° at a magnification of X31,000 (300 kV, 450 e/Å total exposure) on a Technai F30 EM; tomograms of individual negatively stained F-actin troponin-tropomyosin filaments (see Supplementary data) were generated using Protomo software. To improve the signal-to-noise ratio, tomograms of single thin filaments were divided into 40 nm long segments and aligned to a low-resolution model of the filament. The aligned segments were placed within a Gaussian mask to reduce surrounding noise and the rotational and axial alignment refined using SPIDER. Following final alignment, segments were averaged.
Fig. 5
Fig. 5
Cartoon representation of the organization of the thin filament at low-Ca2+. The troponin core domain complexes on either side of F-actin are depicted as W-shaped TnIT structures supporting dumbbell-shaped TnC–; actin, grey; tropomyosin, salmon; TnI, cyan; TnC, red; TnT, yellow. C-terminal TnI extensions are shown emerging from the core domain (as cork-screws), crossing the cleft between neighboring actin monomers and abutting tropomyosin (as a cyan disk). The TnT tail is depicted as an arrow running in parallel to tropomyosin. Tropomyosin is shown wedged in the blocking position between cTerm-TnI on one side and the troponin core domain and TnT on the other in a vise-like grip. No attempt was made to rationalize possible interactions between the troponin core domain and F-actin (here depicted as a double chain of beads for simplicity). Please note: Only one of two tropomyosin strands is shown. Also note: The tip of the TnI extension emanating from the troponin core on the right side of the diagram is hidden behind actin in back of the filament and not seen.

References

    1. Huxley HE. Structural changes in actin- and myosin-containing filaments during contraction. Cold Spring Harbor Symp. Quant. Biol. 1972;37:361–376.
    1. Haselgrove JC. X-ray evidence for a conformational change in actin-containing filaments of vertebrate striated muscle. Cold Spring Harbor Symp. Quant. Biol. 1972;37:341–352.
    1. Parry DAD, Squire JM. Structural role of tropomyosin in muscle regulation: Analysis of the X-ray patterns from relaxed and contracting muscles. J. Mol. Biol. 1973;75:33–55. - PubMed
    1. Lehman W, Craig R, Vibert P. Ca2+-induced tropomyosin movement in Limulus thin filaments revealed by three dimensional reconstruction. Nature. 1994;368:65–67. - PubMed
    1. Vibert P, Craig R, Lehman W. Steric-model for activation of muscle thin filaments. J. Mol. Biol. 1997;266:8–14. - PubMed

Publication types

MeSH terms