. 2008 Sep 15;95(6):2792-805.
doi: 10.1529/biophysj.107.122465. Epub 2008 May 30.

The effect of cholesterol on short- and long-chain monounsaturated lipid bilayers as determined by molecular dynamics simulations and X-ray scattering

Affiliations

The effect of cholesterol on short- and long-chain monounsaturated lipid bilayers as determined by molecular dynamics simulations and X-ray scattering

Norbert Kucerka et al. Biophys J. .

Abstract

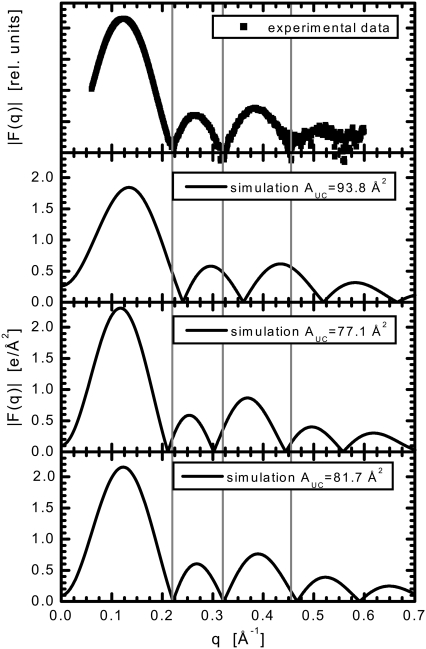
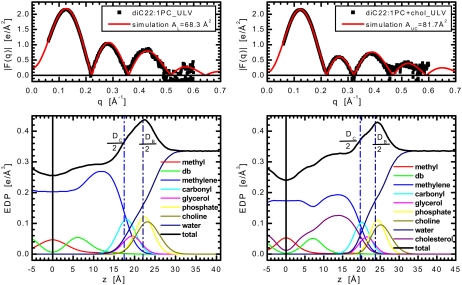
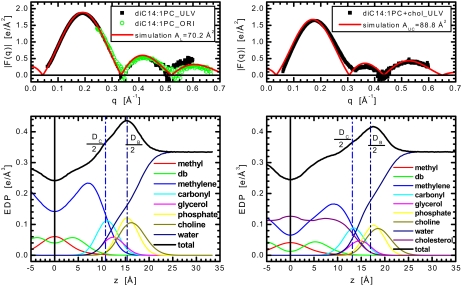
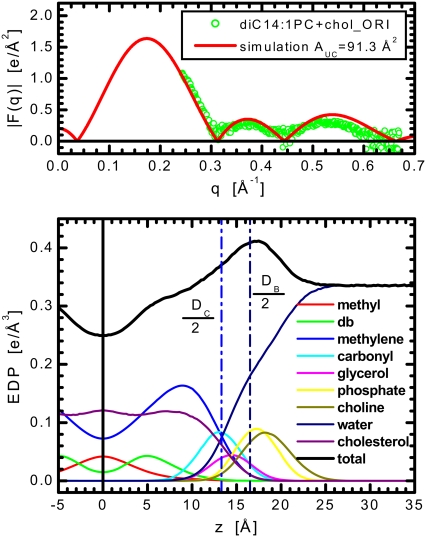
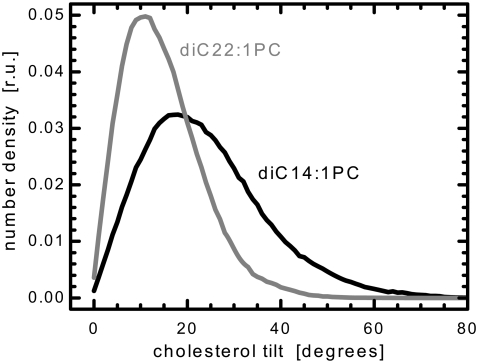
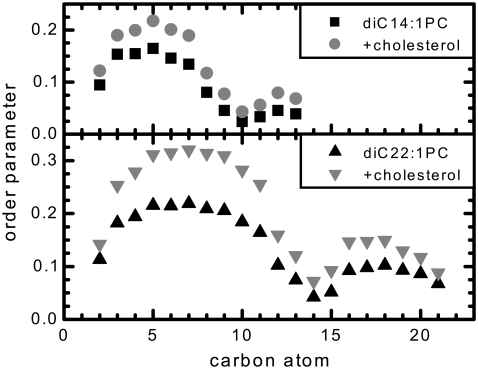
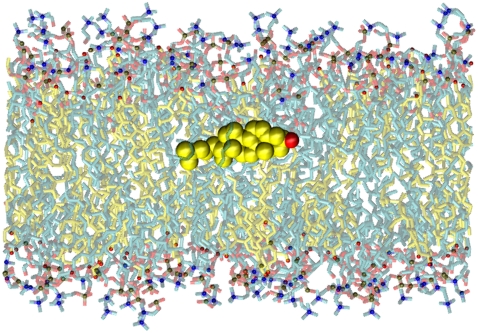
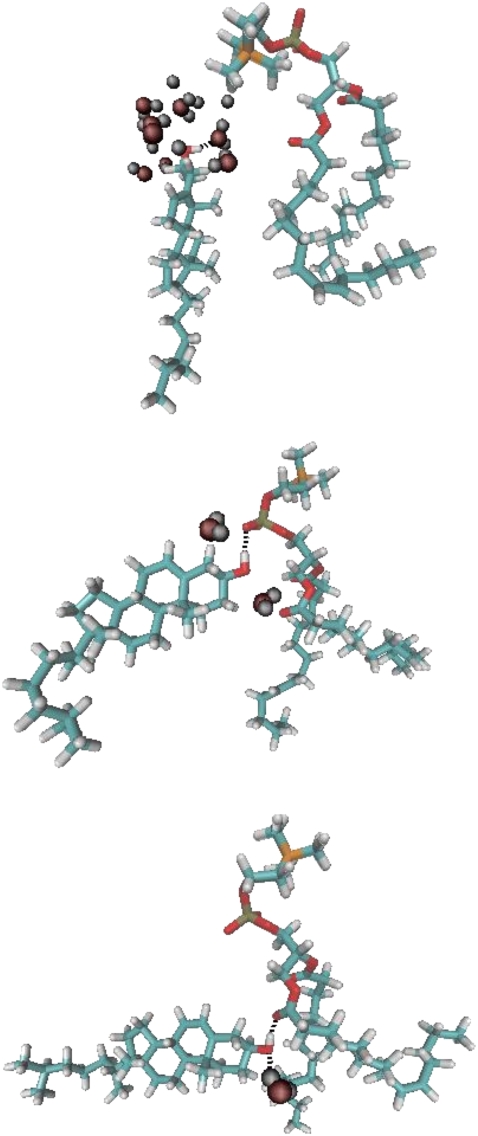
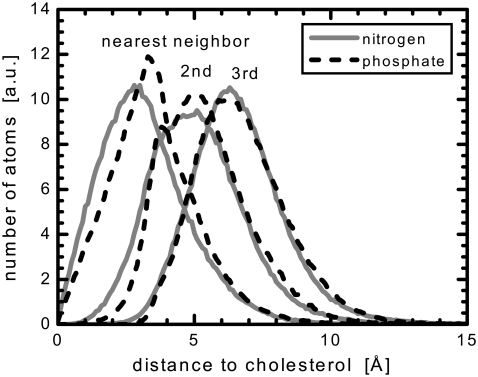
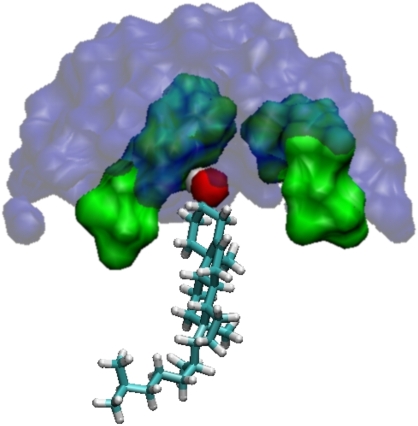
We investigate the structure of cholesterol-containing membranes composed of either short-chain (diC14:1PC) or long-chain (diC22:1PC) monounsaturated phospholipids. Bilayer structural information is derived from all-atom molecular dynamics simulations, which are validated via direct comparison to x-ray scattering experiments. We show that the addition of 40 mol % cholesterol results in a nearly identical increase in the thickness of the two different bilayers. In both cases, the chain ordering dominates over the hydrophobic matching between the length of the cholesterol molecule and the hydrocarbon thickness of the bilayer, which one would expect to cause a thinning of the diC22:1PC bilayer. For both bilayers there is substantial headgroup rearrangement for lipids directly in contact with cholesterol, supporting the so-called umbrella model. Importantly, in diC14:1PC bilayers, a dynamic network of hydrogen bonds stabilizes long-lived reorientations of some cholesterol molecules, during which they are found to lie perpendicular to the bilayer normal, deep within the bilayer's hydrophobic core. Additionally, the simulations show that the diC14:1PC bilayer is significantly more permeable to water. These differences may be correlated with faster cholesterol flip-flop between the leaflets of short-chain lipid bilayers, resulting in an asymmetric distribution of cholesterol molecules. This asymmetry was observed experimentally in a case of unilamellar vesicles (ULVs), and reproduced through a set of novel asymmetric simulations. In contrast to ULVs, experimental data for oriented multilamellar stacks does not show the asymmetry, suggesting that it results from the curvature of the ULV bilayers.


Figures

FIGURE 1
FIGURE 1
Form factors, F(q), from experimental ULV x-ray scattering and MD simulations. Simulations were carried out at three different areas of the simulation box, AMD, fixed at 75 × 75 Å2 (AUC = 93.8 Å2), 68 × 68 Å2 (AUC = 77.1 Å2) and 70 × 70 Å2 (AUC = 81.7 Å2), respectively. Vertical lines mark the positions of the three minima that are clearly evident in the experimental scattering curves.
FIGURE 2
FIGURE 2
Top panels show comparison of experimental ULV form factors, F(q), and those calculated from the simulation carried out at a fixed area which was obtained from the simulation-based analysis of diC22:1PC bilayers without (left top panel) and with (right top panel) 40 mol % cholesterol. The two bottom panels show the electron density profiles (EDP) of half a bilayer as obtained from simulations (black). The lipid molecule is divided into terminal methyl groups (red), double bonded moiety (green), methylenes (blue), carbonyl (cyan), glycerol (magenta), phosphate (yellow), choline (dark yellow), all of which add up to the EDP of a single lipid. The EDP of a total bilayer consists then of lipid EDP, water profile (navy blue) and the EDP of cholesterol (purple).
FIGURE 3
FIGURE 3
Comparison of experimental form factors, F(q) (top panels), and those calculated from a simulation carried out at a fixed area which was obtained from the simulation-based analysis of diC14:1PC bilayers without (left top panel) and with (right top panel) 40 mol % cholesterol. The two bottom panels show the EDP of half a bilayer as determined from simulations. The system is divided into components with the coloring scheme as in Fig. 2.
FIGURE 4
FIGURE 4
Experimental ULV form factors F(q) of diC14:1PC bilayers with 40 mol % cholesterol compared to the simulation carried out with an asymmetric (51/29) distribution of cholesterol. Bottom panel shows the electron density profiles with the coloring scheme as in Fig. 2.
FIGURE 5
FIGURE 5
Experimental ORI form factors F(q) of diC14:1PC bilayers with 40 mol % cholesterol compared to the simulation. Bottom panel shows the electron density profiles with the coloring scheme as in Fig. 2.
FIGURE 6
FIGURE 6
The distribution of cholesterol tilt angles in diC14:1PC and diC22:1PC bilayers. A value of zero indicates a state in which cholesterol is perpendicular to the bilayer plane.
FIGURE 7
FIGURE 7
Deuterium order parameters (−SCD) for the phospholipid tails of diC14:1PC and diC22:1PC bilayers, with and without cholesterol, and averaged over the two leaflets of the bilayer. The values are also averaged over both sn-1 and sn-2 chains, as they were found to be very similar.
FIGURE 8
FIGURE 8
Snapshot of the diC14:1PC + cholesterol bilayer highlighting a cholesterol molecule in the perpendicular orientation. The cholesterol bodies are shown in yellow and hydroxyls in red, with the perpendicular cholesterol shown in space filling form for emphasis; water molecules are omitted for clarity.
FIGURE 9
FIGURE 9
Sequential snapshots of a single lipid (right), cholesterol (left), and water molecules within 5 Å of the cholesterol hydroxyl, showing with detail the dynamically changing interactions that facilitate a cholesterol's transition from an upright to a perpendicular orientation. Other nearby molecules have been omitted to emphasize the relevant details. Black dashed lines suggest potential hydrogen bonds.
FIGURE 10
FIGURE 10
Distribution of distances in the xy-plane from cholesterol's oxygen to the nitrogen and phosphorus of nearest neighbor, next nearest neighbor, and third nearest neighbor diC22:1PC molecules. A value of zero would indicate a position directly above the cholesterol oxygen. The overlapping distributions of the third nearest neighbor reflect a complete lack of preferential headgroup orientation, whereas the nearest lipids show a significant rearrangement.
FIGURE 11
FIGURE 11
A snapshot from the diC14:1PC + cholesterol simulation. The cholesterol molecule is covered by the headgroups of its two neighboring lipids, thus avoiding contact with water molecules. The cholesterol hydroxyl is shown as a red sphere. Surface representations of the lipid headgroups are shown in green. Lipid chains are removed for clarity. Water molecules within 11 Å of the cholesterol hydroxyl are shown in blue.

References

    1. Lee, A. G. 2004. How lipids affect the activities of integral membrane proteins. Biochim. Biophys. Acta. 1666:62–87. - PubMed
    1. Cornelius, F., N. Turner, and H. R. Christensen. 2003. Modulation of Na,K-ATPase by phospholipids and cholesterol. II. Steady-state and presteady-state kinetics. Biochemistry. 42:8541–8549. - PubMed
    1. Mitra, K., I. Ubarretxena-Belandia, T. Taguchi, G. Warren, and D. M. Engelman. 2004. Modulation of the bilayer thickness of exocytic pathway membranes by membrane proteins rather than cholesterol. Proc. Natl. Acad. Sci. USA. 101:4083–4088. - PMC - PubMed
    1. Bretscher, M. S., and S. Munro. 1993. Cholesterol and the Golgi apparatus. Science. 261:1280–1281. - PubMed
    1. Harroun, T. A., W. T. Heller, T. M. Weiss, L. Yang, and H. W. Huang. 1999. Experimental evidence for hydrophobic matching and membrane-mediated interactions in lipid bilayers containing gramicidin. Biophys. J. 76:937–945. - PMC - PubMed

Publication types

MeSH terms