. 2008 Sep 15;95(6):2806-21.
doi: 10.1529/biophysj.108.132563. Epub 2008 May 30.

Four-scale description of membrane sculpting by BAR domains

Affiliations

Four-scale description of membrane sculpting by BAR domains

Anton Arkhipov et al. Biophys J. .

Abstract

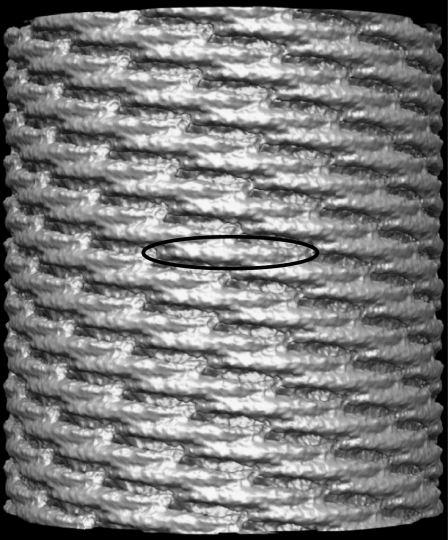
BAR domains are proteins that sense and sculpt curved membranes in cells, furnishing a relatively well-studied example of mechanisms employed in cellular morphogenesis. We report a computational study of membrane bending by BAR domains at four levels of resolution, described by 1), all-atom molecular dynamics; 2), residue-based coarse-graining (resolving single amino acids and lipid molecules); 3), shape-based coarse-graining (resolving overall protein and membrane shapes); and 4), a continuum elastic membrane model. Membrane sculpting performed by BAR domains collectively is observed in agreement with experiments. Different arrangements of BAR domains on the membrane surface are found to lead to distinct membrane curvatures and bending dynamics.


Figures

FIGURE 1
FIGURE 1
Membrane tube formed concertedly by BAR domains. Shown is a cryo-electron microscopy view of F-BAR domains that sculpt a tubular membrane of ∼670 Å diameter. A single F-BAR domain is marked by the solid oval. The image is reproduced from Frost et al. (29).
FIGURE 2
FIGURE 2
Arrangements of BAR domains studied. The systems studied by simulations are periodic; the simulation box is highlighted as a solid square, and a few periodic images are shown in dimmed color; boundaries of periodic cells are marked by dotted lines. (A) Nonstaggered one-row arrangement. (B) Staggered two-row arrangement.
FIGURE 3
FIGURE 3
Residue-based coarse-grained (RBCG) and shape-based coarse-grained (SBCG) models. (A) Overlap of all-atom and RBCG models for a DOPC lipid and AWLFV peptide. RBCG uses ∼10 atoms per CG bead; an amino acid is represented by one bead for the backbone and another one for the side chain. (B) SBCG model of a protein segment, with ∼150 atoms per CG bead. Each CG bead has the same color as the all-atom domain represented by the bead. (C) Side- and top-views of the SBCG model of a small DOPC membrane patch. Each SBCG molecule corresponds to 2.2 lipids on average and consists of two beads, one representing the lipid heads (cyan) and the other the lipid tails (white). (D) DOPC membrane represented by all-atom, RBCG, and SBCG models. (EG) BAR domain viewed from top and side, in all-atom (E), RBCG (F), and SBCG (G) representations. The BAR domain is a homodimer; the monomers are shown in purple and green. In the SBCG model, the two monomers are connected by bonds (orange) to preserve the integrity of the dimer.
FIGURE 4
FIGURE 4
Constraints are necessary to maintain the tertiary structure and interdomain arrangement for the RBCG model of BAR domain. (A) A BAR domain dimer is shown in top and side view. Several distances and angles are chosen that characterize the overall structure of the protein. These are the distance between the centers of mass of the two monomers (LCOM), end-to-end distance for the whole dimer (LETE), end-to-end distance for one monomer (Lmonomer), and the opening angles for the dimer and for the monomer (θdimer and θmonomer). Averages of these values, as well as of Cα-RMSD for the dimer, are shown in panels BG for, from left to right, the all-atom simulation (1st bar), and RBCG simulations with K = 5 kcal/(mol Å2) (2nd bar), K = 25 kcal/(mol Å2) (3rd bar), K = 0.5 kcal/(mol Å2) (4th bar), and K = 0 (5th bar). Restraints with K = 5 kcal/mol Å2 provide the best agreement between the all-atom and RBCG simulations, and, thus, was used further on.
FIGURE 5
FIGURE 5
Tuning bonded forces in SBCG models. (A) Bond constants Kb for all bonds in the SBCG model of the BAR domain. Using Boltzmann inversion, Kb values are extracted from an all-atom simulation (solid representation). These values of Kb are used in a SBCG simulation. The Boltzmann inversion is performed on the resulting SBCG trajectory, but the Kb values extracted are significantly higher (dotted) than those obtained from the all-atom simulation. Then, Kb constants used for the SBCG simulation are all multiplied by the same number (0.3 in this example), and a new SBCG simulation is carried out with these constants. The Boltzmann inversion performed on the new SBCG trajectory returns Kb values (shaded representation) that are much closer to those found in the all-atom simulation. Thus, the scaled constants are better suited for SBCG simulations. (B and C) DOPC leaflet thickness (defined as the distance between the centers of mass of the upper and lower parts of a lipid, averaged over the leaflet) and its RMSD recorded in all-atom (solid representation) and SBCG (shaded representation) simulations of a patch of DOPC bilayer. The all-atom and SBCG simulations produce matching results when the SBCG bond parameters are r0 = 12.0 Å and Kb = 0.2 kcal/(mol Å2), which are the values used in all further SBCG simulations. A variation of these parameters, such as r0 = 12.5 Å and Kb = 0.3 kcal/(mol Å2), produce a noticeable deviation.
FIGURE 6
FIGURE 6
SBCG model for lipids. A patch of DOPC membrane is shown from the top and from the side, in an all-atom as well as in SBCG representations. The head and tail halves of the all-atom lipids are shown in cyan and white, respectively. Each SBCG molecule represents ∼2.2 lipids; the head SBCG beads are in green, and the tail beads are in pink.
FIGURE 7
FIGURE 7
Determination of the bending rigidity of the SBCG membrane. Shown at the top is an example bilayer tube that emulates a tether pulled from the membrane in experiments measuring the bending rigidity. Tubes of various radii were simulated with harmonic restraints applied to the ends of the tube (darker CG beads at the tips of the tube). The force experienced by the restrained beads was computed and used to estimate the bending rigidity, according to Eq. 4. Results of these measurements are shown at the bottom, where the estimated bending rigidity (in units of temperature, T = 300 K) is plotted versus the average tube radius.
FIGURE 8
FIGURE 8
SBCG simulations of DOPC self-assembly. Formation of a multilamellar structure is shown in panel A, and of a single bilayer in panel B. In both cases, the system consists of 300 SBCG two-bead molecules, corresponding to ∼660 DOPC lipids, and the simulations start from a randomized mixture of SBCG molecules. The periodic cell is 100 × 100 × 100 Å3 in panel A (shown as an open square), and 183 × 122 × 218 Å3 in panel B (one cell is shown). In panel A, lamellar-like structures form quickly and then stabilize with time, producing eventually stacks of bilayers. In panel B, a number of large and small micelles forms first, but then almost all lipids aggregate into a single bilayer extending over the entire size of the periodic cell. A large micelle that has not fused with the bilayer can be seen at the snapshots at the bottom.
FIGURE 9
FIGURE 9
Single BAR domain simulations. (AC) Snapshots from all-atom simulation 1BAR-AA, one of RBCG simulations 1BAR-RB, and one of the SBCG simulations 1BAR-SB. Negatively charged PS lipid headgroups are shown in red, and neutral PC headgroups are shown in cyan. The protein consists of two monomers, shown in green and purple. (D) Time evolution of membrane curvature. The two black dots are the curvatures from two all-atom simulations reported in Blood and Voth (30), averaged from time 20–27 ns. The black curve is from simulation 1BAR-AA; red, orange, and magenta are from simulations 1BAR-RB; the rest (turquoise, blue, green, deep green, cyan) are from simulations 1BAR-SB.
FIGURE 10
FIGURE 10
Membrane curvature induced by multiple BAR domains. (A) Six BAR domains in the nonstaggered arrangement in RBCG simulation 6BAR-1row-RB. (B) Six BAR domains in the staggered arrangement in RBCG simulation 6BAR-2row-RB. Upper and middle panels in panels A and B show side- and top-views of the initial setup. Lower panels are snapshots after 20 or 50 ns. (C) BAR domains in the SBCG simulations 6BAR-1row-SB. (D) BAR domains in the SBCG simulations 6BAR-2row-SB.
FIGURE 11
FIGURE 11
Time evolution of membrane curvatures in the simulated six-BAR domain systems. The shaded number n (1, 2, 3, 4, 5, or 6) denotes that the curve is for the membrane beneath BAR domain n shown in Fig. 10, A and B. (A) Local curvatures in simulation 6BAR-1row-RB. (B) Local and global curvatures in the staggered arrangement of BAR domain systems at t < 50 ns. Numbered curves are for local curvatures in the RBCG simulation 6BAR-2row-RB. The thick curves (deep green, cyan, blue, sage, and turquoise) are global curvatures observed in each of the five SBCG simulations 6BAR-2row-SB, and the black curve is the global curvature from 6BAR-2row-RB.
FIGURE 12
FIGURE 12
Six-BAR domain systems at t < 5 μs. (A and B) Snapshots at 5 μs for 6BAR-1row-SB (A) and 6BAR-2row-SB (B). (C) Time evolution of global curvatures. The five curves at the bottom are for simulation 6BAR-1row-SB, the five at the top for 6BAR-2row-SB.
FIGURE 13
FIGURE 13
Membrane dynamics in EM computations. (A) Snapshots of the membrane shape in a typical EM computation. (B) End-to-end distance of the membrane over time. The fluctuating curves are taken from simulations 6BAR-2row-SB, and smooth curves are from EM computations.

References

    1. Zimmerberg, J., and M. M. Kozlov. 2006. How proteins produce cellular membrane curvature. Nat. Rev. Mol. Cell Biol. 7:9–19. - PubMed
    1. Rothman, J. E., and L. Orci. 1996. Budding vesicles in living cells. Sci. Am. 274:70–75. - PubMed
    1. Lecuit, T., and F. Pilot. 2003. Developmental control of cell morphogenesis: a focus on membrane growth. Nat. Cell Biol. 5:103–108. - PubMed
    1. Marsh, M., and H. T. McMahon. 1999. The structural era of endocytosis. Science. 285:215–220. - PubMed
    1. Kirchhausen, T. 2000. Clathrin. Annu. Rev. Biochem. 69:699–727. - PubMed

Publication types

LinkOut - more resources